
10 Best FREE Trading Indicators for Traders

Crypto trading is a lucrative but risky business. You need to know how to analyze the market trends, patterns, and signals to make profitable decisions. Indicators are tools that help you do that. They use data and statistics to give you insights into market behavior and direction.
This article will tell you the ten best free trading indicators for crypto trading in 2023 that will help you trade like a pro.
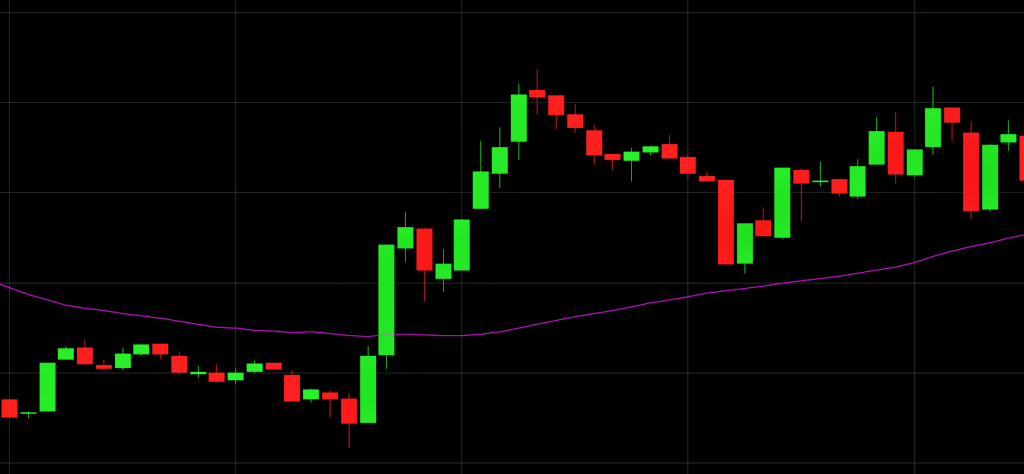
Moving Averages
Moving averages show you the average price of crypto over a certain period. They smooth out price fluctuations and reveal the trend direction and strength. You can use moving averages to identify uptrends, downtrends, or sideways trends; to find support and resistance levels; and to generate trading signals.
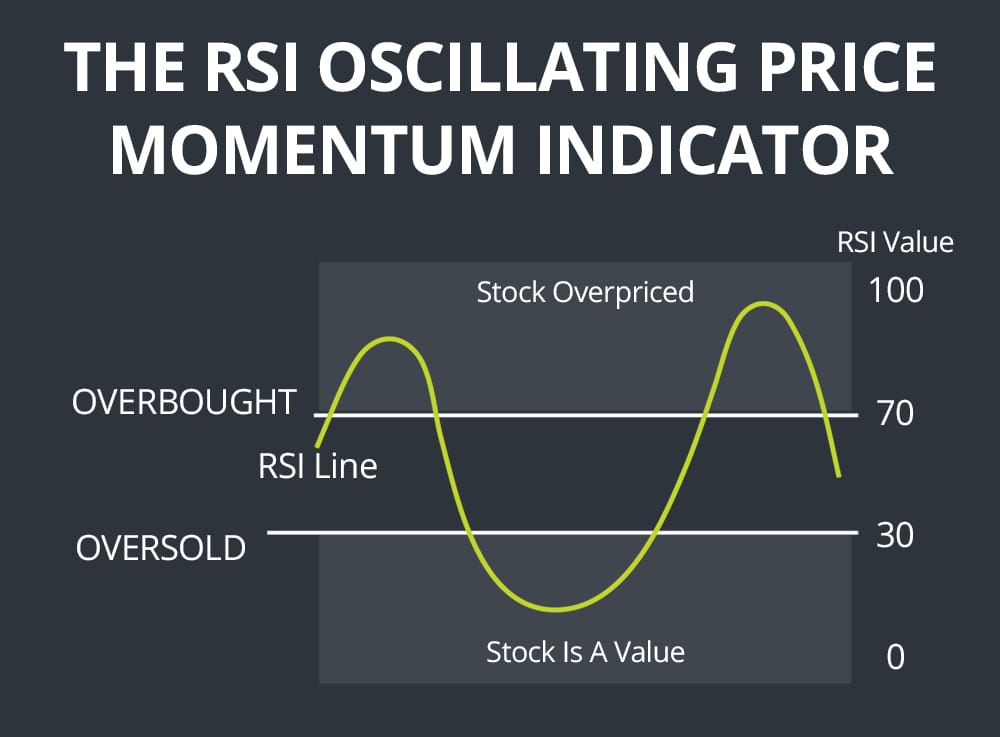
Relative Strength Index (RSI)
The RSI measures how strong a crypto’s price movement is by comparing its recent gains and losses. It has range from 0 to 100, with readings above 70 indicating overbought and below 30 indicating oversold. You can use the RSI to spot potential reversals by looking for divergences, identifying overbought or oversold conditions, and confirming the trend direction.
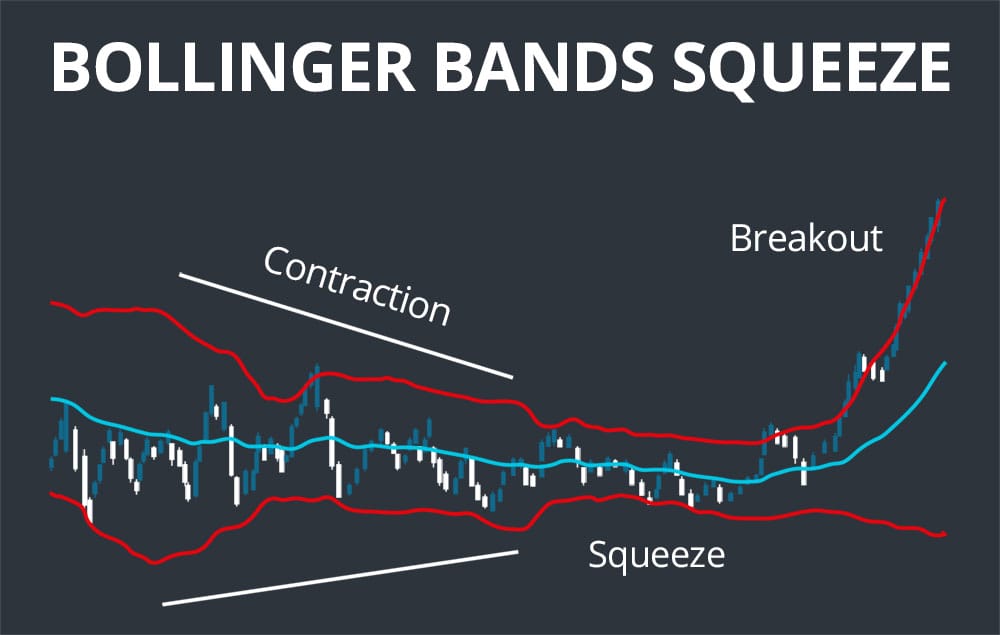
Bollinger Bands
Bollinger Bands consist of three lines: a middle line that is a moving average and two outer lines that are standard deviations away from it. They measure the volatility and range of the market. You can use Bollinger Bands to detect periods of high or low volatility, find breakout or reversal points, and gauge the trend strength.
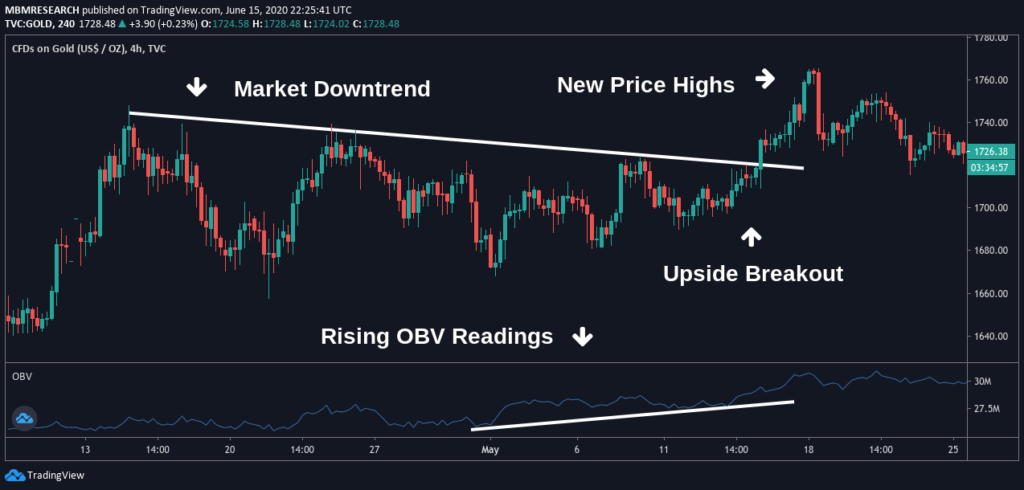
On-Balance-Volume (OBV)
The OBV tracks the volume flow of crypto. It adds volume on days when the price closes higher and subtracts volume on days when the price closes lower. It shows you the buying and selling pressure behind the price movement. You can use OBV to confirm the trend direction by looking for a positive or negative slope, spot divergences, and identify accumulation or distribution phases.
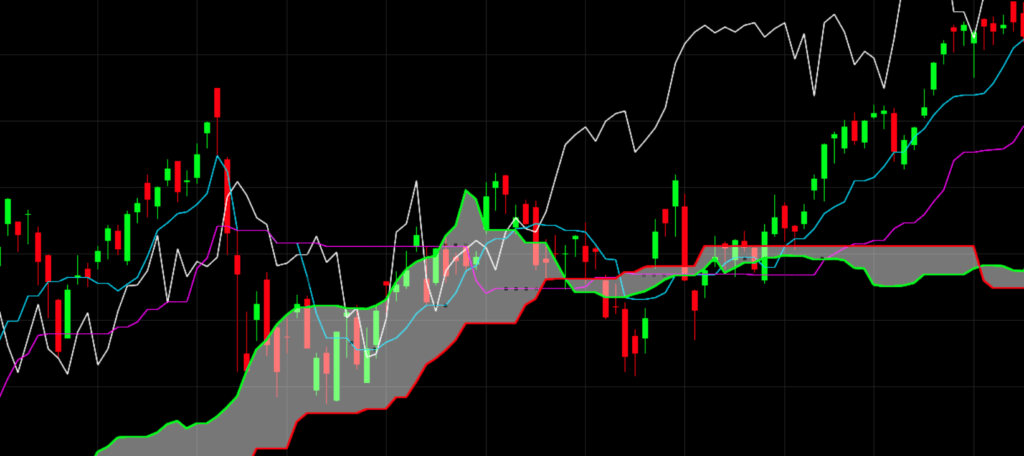
Ichimoku Cloud
The Ichimoku Cloud is a complex indicator with five lines: Tenkan-sen, Kijun-sen, Senkou Span A, Senkou Span B, and Chikou Span. They show you the trend direction, momentum, support and resistance levels, and trading signals. You can use the free trading indicators like Ichimoku Cloud to determine whether the market is bullish or bearish by looking at the color and position of the cloud, to find entry or exit points by looking at the crossover of Tenkan-sen and Kijun-sen, and to assess the trend strength by looking at the distance between Senkou Span A and B.
Moving Average Convergence Divergence (MACD)
The MACD is a trend-following indicator with two lines: MACD line and signal line. MACD line is calculated by subtracting a longer-term moving average from a shorter-term moving average. Signal line is a moving average of MACD line. They show you the direction and momentum of the trend. You can use MACD to find trend changes by looking at the crossover of the MACD line and signal line, to spot divergences, and to measure the trend strength by looking at the distance between the MACD line and the signal line.

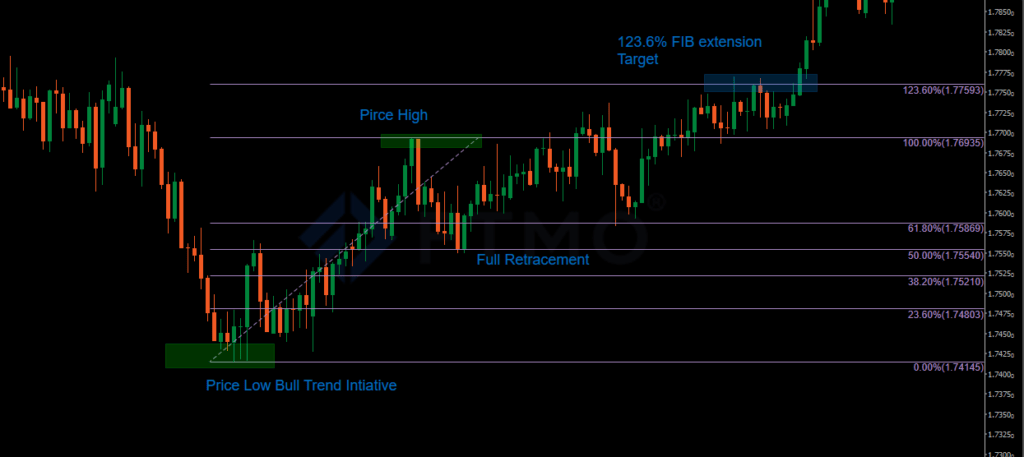
Fibonacci Retracement
Fibonacci Retracement is a tool that uses Fibonacci ratios (23.6%, 38.2%, 50%, 61.8%, and 78.6%) to divide a price movement into segments. It shows potential reversal points where the price may bounce or break through. You can use Fibonacci Retracement to find support or resistance levels by drawing horizontal lines at Fibonacci ratios, anticipating price targets using Fibonacci extensions, and placing stop-loss orders using the Fibonacci levels.
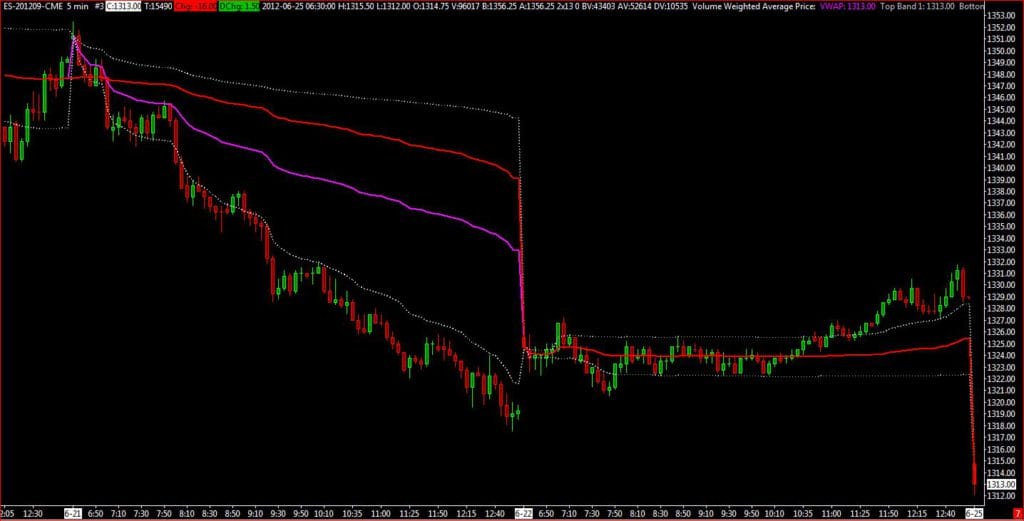
Volume Weighted Average Price (VWAP)
VWAP is a technical analysis tool that calculates the average price of crypto weighted by volume for a given time frame. It helps traders measure the fair value of crypto and identify trading opportunities. You can use VWAP to compare the current price to the VWAP, find support and resistance levels, and execute trades at optimal prices.
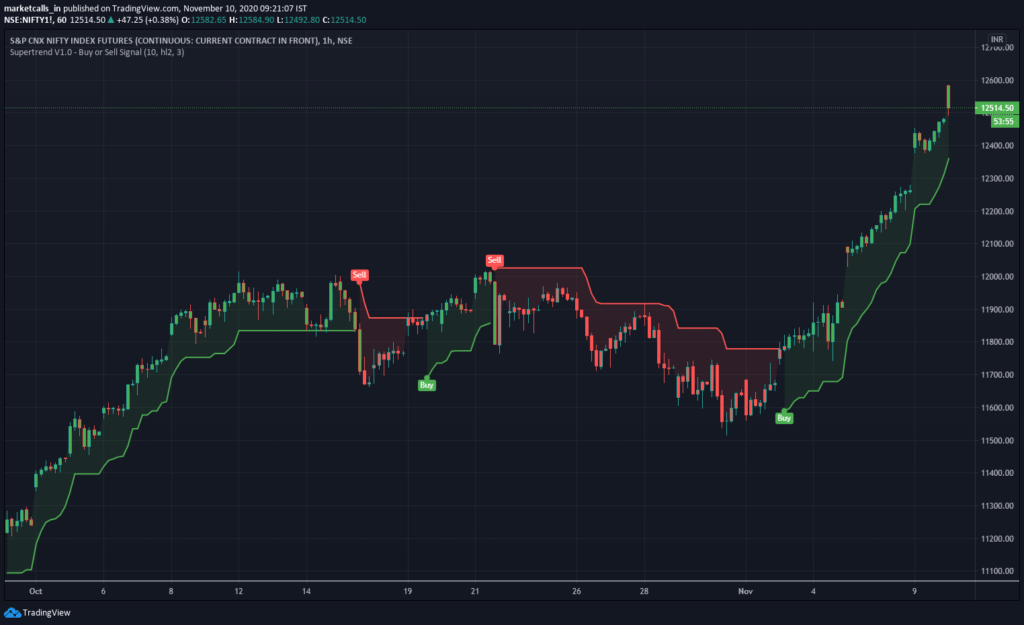
Supertrend
The Supertrend is a trend-following indicator that consists of a line that changes color depending on the direction of the trend. It helps traders identify the trend direction and generate trading signals. For example, you can use Supertrend to determine whether the market is bullish or bearish simply by looking at the color of the line, to find entry or exit points by looking at the crossover of price and line, and to place trailing stop-loss orders by using the line as a reference point. It’s one of the best free trading indicators around!
Pivot Points
Pivot Points are horizontal lines that divide the price range of crypto into different levels. They help traders find potential reversal points and breakout points in the market. For example, you can use Pivot Points to find support and resistance levels by drawing horizontal lines at pivot points R1, R2, S1, and S2; to anticipate price targets by using pivot point extensions; and to confirm the trend direction by using pivot points in conjunction with other indicators.

These 10 best free trading indicators for crypto trading in 2023 will help you trade like a pro. By using these indicators with other tools and analysis methods, you can develop effective trading strategies that suit your style and goals. Remember, indicators are not magic bullets that guarantee success. They are only tools that help you make better decisions based on data and statistics. In the process of becoming a successful crypto trader, you must still practice risk management, discipline, and patience.
Join our telegram channel for trading guidance from the best quality traders!
Also, Read