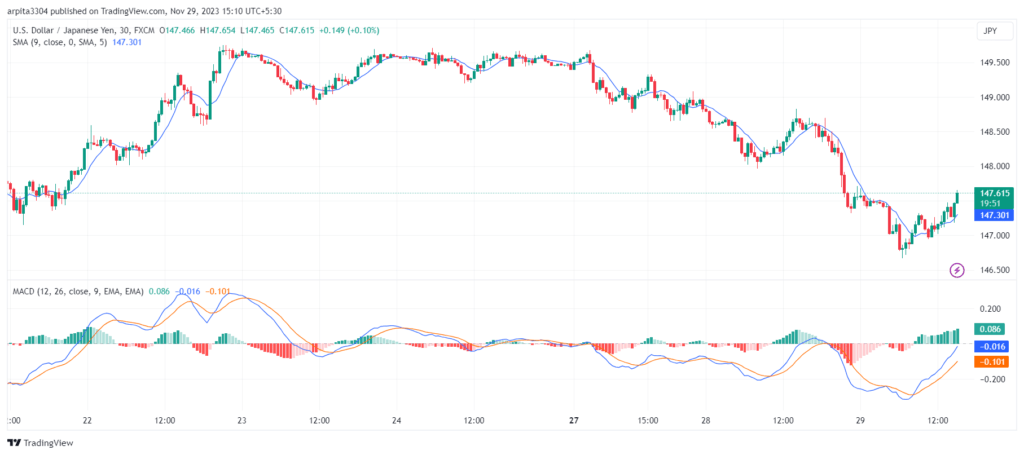
Top 3 best JPY/USD Indicators a Trader must use
Are you a Japanese forex trader looking for the best indicators to use when analyzing the Yen? We’ve got you covered! ????
We’ll break down the top three indicators that help you keep an eye on if you’re trading the Yen.
These reliable indicators give you insights into how the Yen is doing. So, if you want to get a better understanding of what’s driving big moves in this Asian currency, you’ll want to keep an eye on these key indicators. With a better understanding of them, you’ll be able to identify potential opportunities and navigate the Yen better.

- JPY stands for Japanese Yen. It is the official currency of Japan and is widely used in the country for various transactions. The symbol for the Japanese Yen is ¥.
- In the context of financial markets, JPY is a commonly traded currency, and its exchange rate is monitored by traders and investors worldwide.
- It is commonly used in the foreign exchange (forex) market. Traders often use the JPY as a base in currency pairs, such as USD/JPY (U.S. Dollar/Japanese Yen) or EUR/JPY (Euro/Japanese Yen), to speculate on the exchange rate movements between the Japanese Yen and other major currencies.
Join Coincodecap Signals to level up your trading game with automated trading and accurate trading signals with proper explanation.
The Top 3 JPY/USD Indicators are
Relative Strength Index (RSI)
- The RSI is a momentum oscillator that measures the speed and change of price movements. It ranges from 0 to 100 and is often used to identify overbought or oversold conditions. In the context of USD/JPY, an RSI above 70 may indicate an overbought market, suggesting a potential reversal, while an RSI below 30 could signal an oversold condition, hinting at a possible upward correction.
- RSI is used by traders to predict potential trend reversal and confirm the validity of a long-term trend. It also helps in identifying entry and exit signals, particularly in a volatile market like JPY/USD.
For a detailed explanation Read –> Understanding the Relative Strength Index (RSI)

Moving Averages
- Moving averages are one of the most important indicators for traders looking for trends and trend reversal. The 50-day moving average and the 200-day MA are the most widely used moving averages.
- When the short-term MA crosses above the long-term MA, it indicates the possibility of an uptrend. Conversely, when the MA crosses over the opposite extreme, it indicates a possibility of a downtrend.
- Moved average indicators are used by traders to confirm trends, establish entry and exit positions, and prevent false signals. As USD/JPY pairs show different trends, these indicators play an important role in determining the overall market trend.
Also Read –> Understanding Moving Average Convergence Divergence (MACD)

Bollinger Bands
- The Bollinger Bands are formed by a middle band, which is a simple N-period moving average, and a higher and lower band, which are calculated on the basis of volatility. In USD/JPY, Bollinger Bands help traders determine periods of high volatility and periods of low volatility. A price that touches or exceeds the Bollinger Bands may indicate a potential turning point or continuation point.
- Bollinger Bands are used by traders to measure volatility levels, spot breakout opportunities, and determine when the market is overbought or underbought. Because USD/JPY has a tendency to go through periods of calm and periods of turbulence, these bands play an important role in making trading decisions.
To know more about how Bollinger Bands work Read –> Understanding the Bollinger Bands Indicator

Conclusion
The Japanese Yen (JPY) is an important currency for forex traders to understand. When trading the JPY, there are three key indicators that provide insights – the Relative Strength Index (RSI), Moving Averages, and Bollinger Bands.
The RSI helps identify overbought or oversold conditions and potential trend reversals in the JPY. Moving Averages reveal overall trends and entry/exit points signaling changes. Finally, Bollinger Bands measures volatility and periods when the JPY may be overextended.
Together, these three indicators give traders comprehensive momentum, trends, and volatility in the Japanese Yen. By mastering these, forex traders can better time entries and exits when trading the Yen, reacting to opportunities faster and with more confidence. In the fast-paced world of currency trading, these indicators provide an edge in analyzing Japanese Yen price action.
What does JPY stand for?
Japanese Yen
In which market is JPY commonly traded?
Foreign exchange (forex) market
Why is RSI used by traders in the context of USD/JPY?
To predict potential trend reversal and confirm the validity of a long-term trend
Which moving averages are commonly used to determine trends and trend reversals?
50-day and 200-day moving averages
What do Bollinger Bands help traders determine in USD/JPY?
Periods of high volatility and periods of low volatility
