How to Trade Bullish and Bearish Engulfing Candlestick Pattern
Imagine reading the story of a stock’s price movement on a chart. When you look at a chart of a stock, it can tell you a lot about how the market is feeling. Two candles can tell you two different stories – one about being optimistic and one about being cautious. These are known as bullish or bearish engulfing signals, and they’re used by traders to stay on top of the ups and downs of the financial markets.
Table of Contents
An Overview of Bullish and Bearish Engulfing
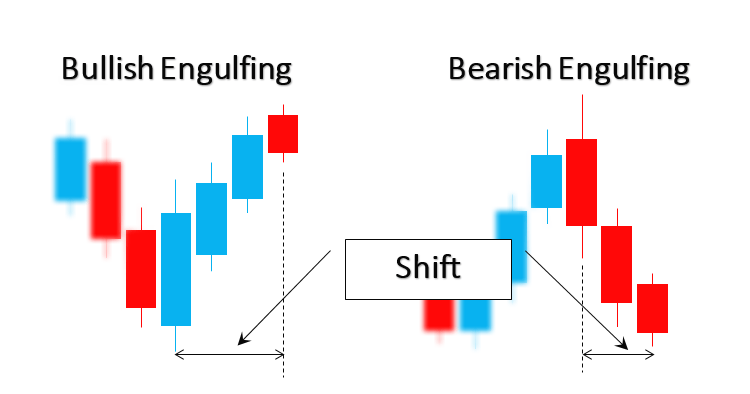
An engulfing candlestick pattern is a two-candle pattern on a price chart that indicates a market reversal.
The second candle is larger than the first and completely covers or “engulfs” the length of the previous candle.
Engulfing Patterns can occur in either an uptrend or downtrend.
There are two types of engulfing patterns: Bullish and Bearish Engulfing.
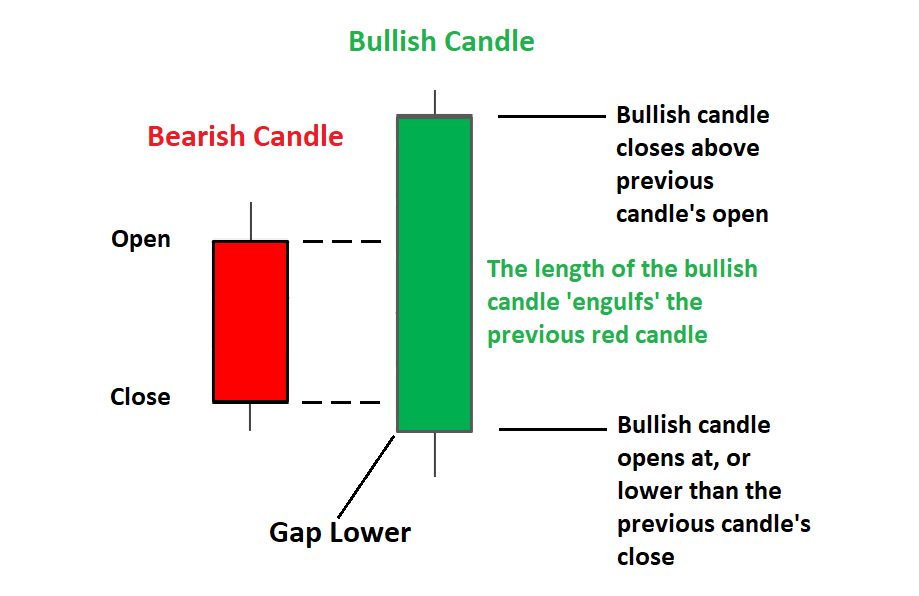
A bullish engulfing pattern is a combination of one dark candle followed by a larger hollow candle.
What does it look like?

What is Bullish Engulfing?
A Bullish Engulfing pattern is like a signal in stock trading. Imagine you have two days of stock price charts:
Day 1: The stock’s price goes down a little, represented by a small black candlestick.
Day 2: The stock’s price goes up a lot, represented by a big white candlestick.This white candlestick completely covers the small black one from the previous day.

Also Read –> How to Trade Cup and Handle Pattern
How to Trade using Bullish Engulfing
Confirmation:-
Ensure that the Bullish Engulfing pattern meets these conditions:
1. The first candlestick shows a downward price trend.
2. The second candlestick begins with an opening price lower than the closing price of the first day and finishes with a closing price higher than the first day’s opening.
Entry:-
When you spot a Bullish Engulfing pattern and other indicators signal a favorable buying opportunity, consider entering the trade by purchasing when the price rises above the highest point of the large white candlestick on the second day.
Exit:-
When your trade reaches the profit goal you set or if the market conditions no longer align with your bullish expectations, it’s time to close the trade. Stick to your trading strategy and resist making emotional decisions.
Risk management:-
Make sure you have a risk management strategy ready. This involves placing a stop-loss order to limit potential losses and deciding how much you’ll invest based on how much risk you’re willing to take.
What is Bearish Engulfing?
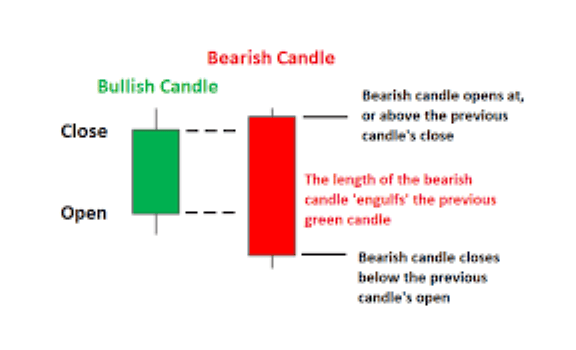
Day 1: The candlestick of the first day is usually black or red, which means it’s a day when the price of the stock is going down.
Day 2: If you see a green or white candlestick on the second day and it’s a lot bigger than the first, that’s a good sign.
The most important thing is that it covers the entire width of the first-day candlestick, including both the start and end prices.

How to Trade using Bullish Engulfing
Confirmation:-
Ensure that the Bearish Engulfing pattern meets these conditions:
- The first candle (white or green) should be bullish, indicating a day with an increase in price.
- The second candle should be black or red, which means it’s bigger and completely covers the first candle, including the opening and closing prices.
Entry:-
Based on the Engulfing pattern, as well as any support indicators, decide where to open the trade (normally short or buy put options).
The entry point is usually just below the bottom of the 2nd day’s bearish candle.
Exit:-
When your trade reaches the profit goal you set or if the market conditions no longer align with your bullish expectations, it’s time to close the trade.
Stick to your trading strategy and resist making emotional decisions.
Risk management:-
Make sure you have a risk management strategy ready. Create a stop-loss order over the top of the bullish engulfing candle and set a profit target so you can take profits if the trade goes your way.
Conclusion
- Once you’ve closed the trade, take a look at what you did and what you achieved. Learn from every trade, analyse what worked well and what you could have done differently to enhance your trading skills in the long run.
- For a greater chance of success in the stock market, traders use these patterns together with basic indicators, risk management strategies, and smart trading. Never forget that trading has risk, and it’s crucial to continuously learn about and adapt to market conditions.
Also Read –> How To Trade Head and Shoulder Pattern

(Frequently Asked Question) FAQ
How do you identify bullish and bearish engulfing?
The first candle is a bullish (bullish) candle. The second candle is a bearish (black) candle. The black candle must cover the white candle completely.
Can engulfing patterns predict exact price levels?
Engulfing patterns offer reversal signals, but they do not specify exact price levels. Instead, traders use other indicators such as support and resistance levels (SDRs) or Fibonacci Retracement levels (FTRs) to find entry and exit points.
What timeframe is bullish engulfing?
If the candle pattern on the 2-hour timeframe is a Bullish ENGULING PATTERN, then on the 4-hour timeframe, the candle pattern is a Hammer. Basically, a bullish engulfing pattern (or hammer) means the buyers have the upper hand for now.
What are the rules for engulfing patterns?
Yesterday’s close must be lower than yesterday’s open.
Today’s open is lower than yesterday’s close.
Today’s close is higher than yesterday’s open.
If the numbers add up to 1-3, then it’s time to buy the dip. We buy when the closing price is higher than the closing price from the day before.
