Crypto Chart Pattern Cheat Sheet
Welcome to the crypto chart pattern cheat sheet. This cheat sheet is a handy guide that will help you learn and recognize some of the most common and useful patterns that form on the price charts of cryptocurrencies.
Crypto chart patterns are shapes that show how the price of a cryptocurrency moves over time, and they can give you clues about the direction and trend of the market. By understanding these patterns, you can improve your crypto trading skills and results.
I. Reversal Chart Patterns
A. Head and Shoulders Pattern
- Formation of higher high (head) between two lower highs (shoulders).
- Neckline acts as a support-turned-resistance level.
- Indicates potential trend reversal from bullish to bearish.

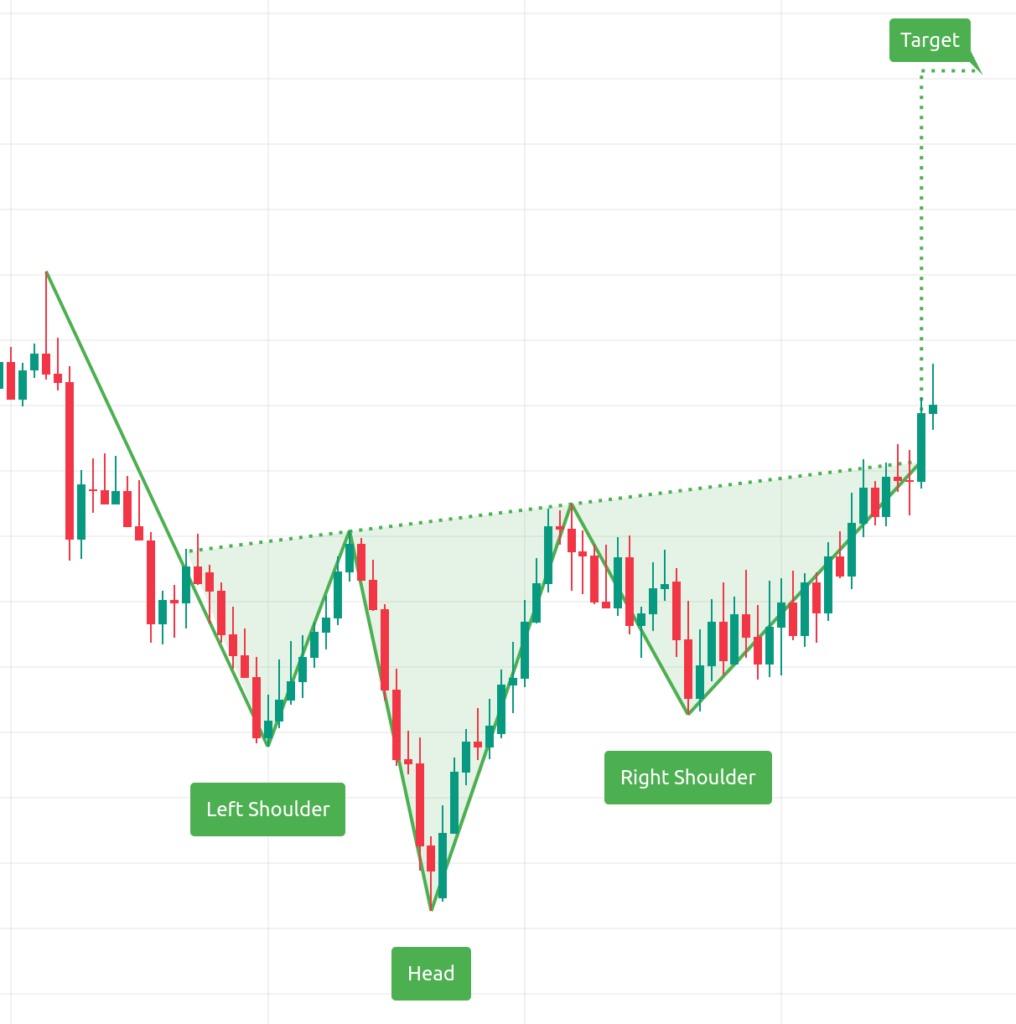
B. Inverse Head and Shoulders Pattern
- Formation of lower low (head) between two higher lows (shoulders).
- Neckline acts as a resistance-turned-support level.
- Indicates potential trend reversal from bearish to bullish.
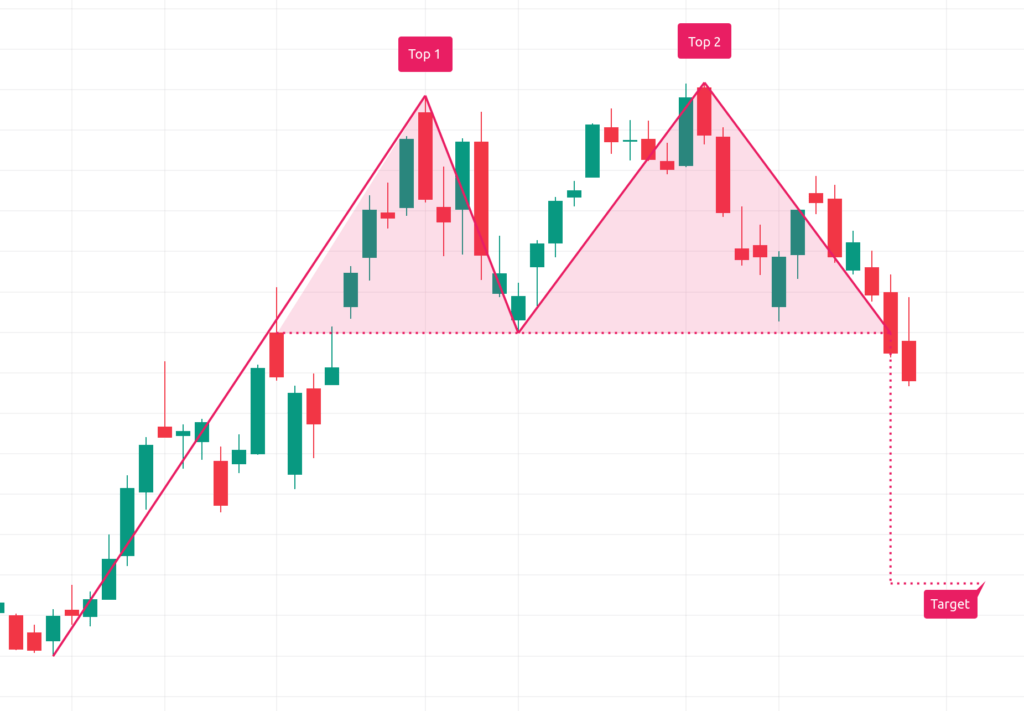
C. Double Top Pattern
- Formation of two consecutive peaks at similar levels.
- Neckline acts as a crucial support.
- Suggests a potential trend reversal from bullish to bearish.
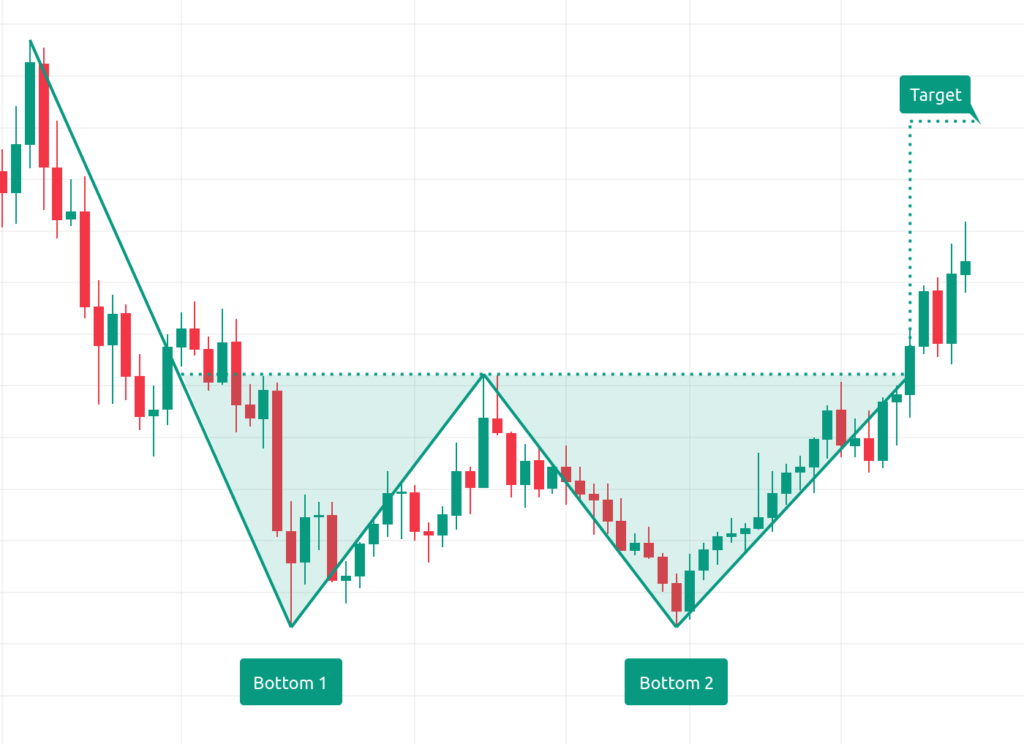
D. Double Bottom Pattern
- Formation of two consecutive troughs at similar levels.
- Neckline acts as a crucial resistance.
- Suggests a potential trend reversal from bearish to bullish.
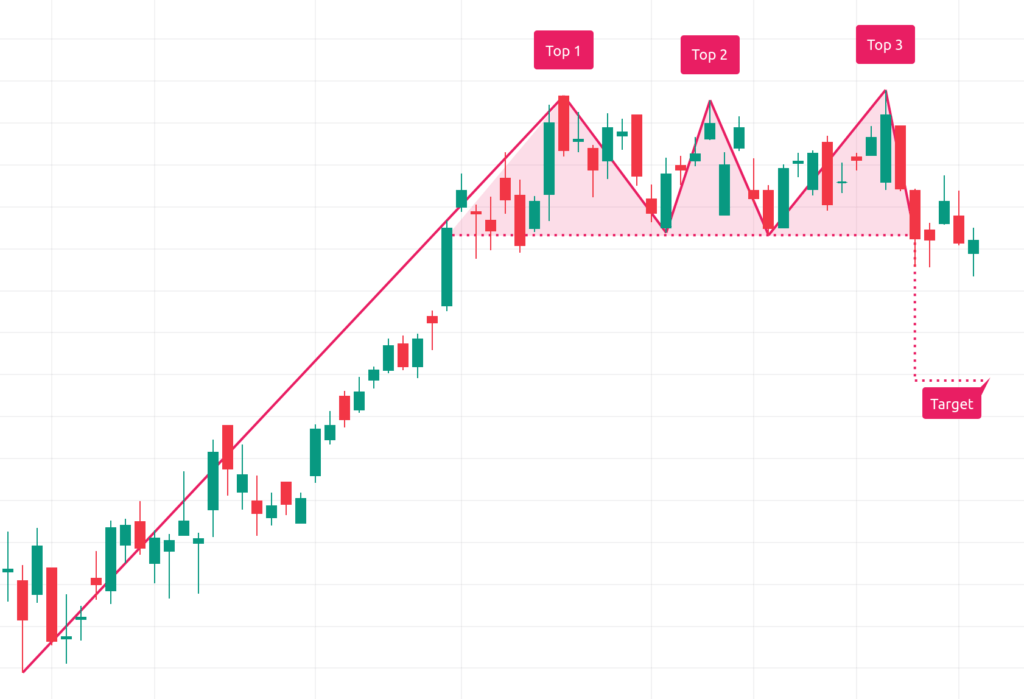
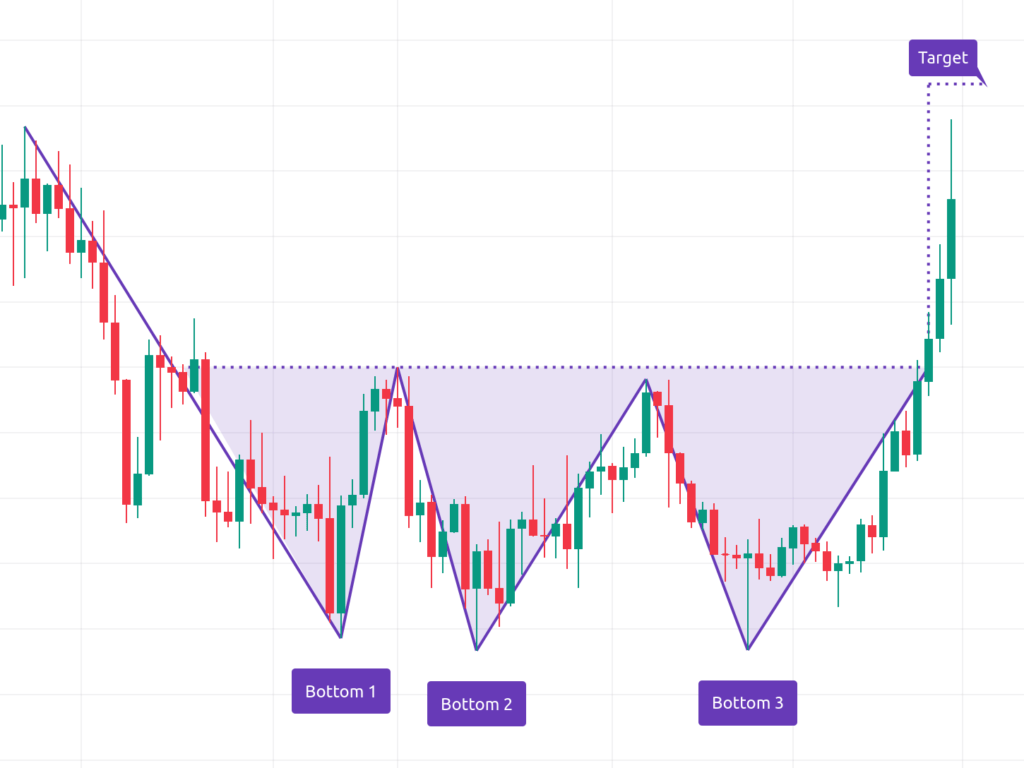
E. Triple Top and Triple Bottom Patterns
- Similar to double top and double bottom, but with three peaks or troughs.
- Suggests stronger potential reversals due to multiple failed attempts.
II. Continuation Chart Patterns
A. Flag Pattern
- Brief consolidation phase following a strong price movement.
- Resembles a flagpole (strong move) and a flag (consolidation).
- Typically continues the prior trend after consolidation.

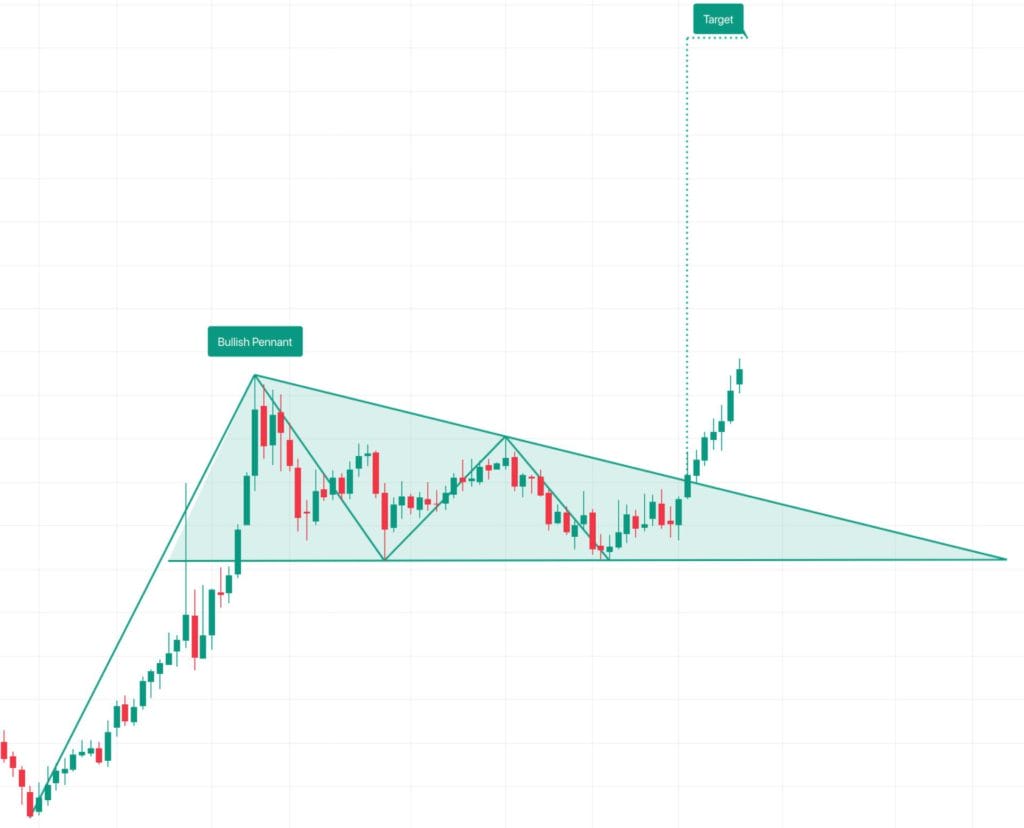
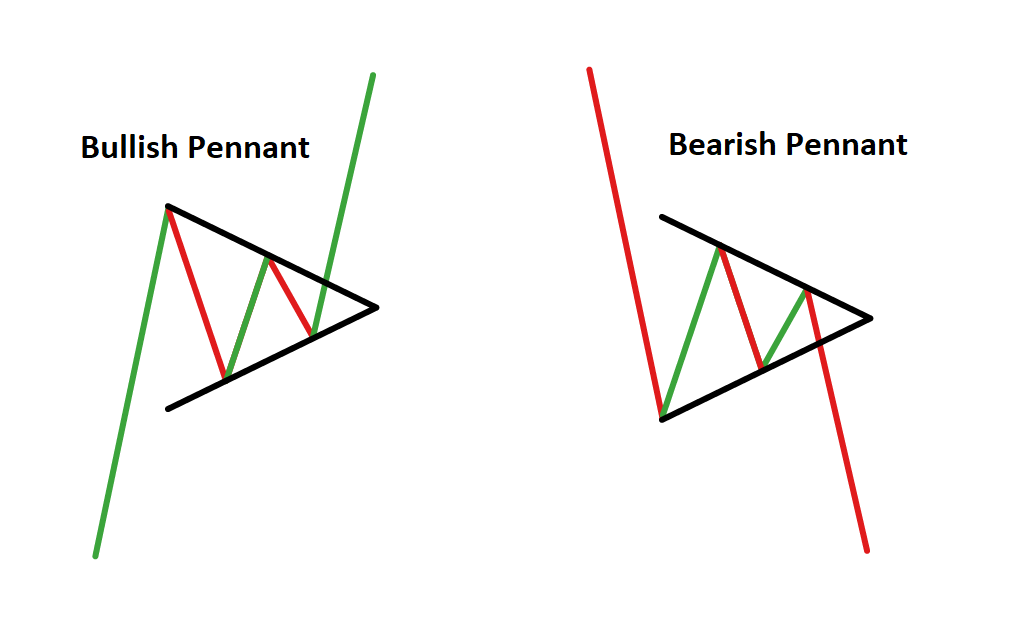
B. Pennant Pattern
- Similar to a flag pattern, characterized by a small symmetrical triangle.
- Indicates a temporary pause before the trend resumes.
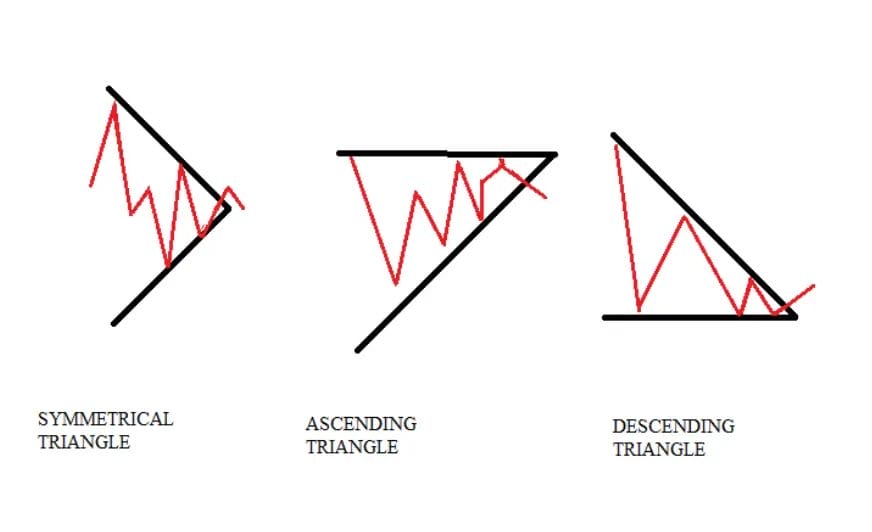
C. Triangle Patterns (Ascending, Descending, Symmetrical)
- Ascending triangle: Higher lows and a horizontal resistance.
- Descending triangle: Lower highs and a horizontal support.
- Symmetrical triangle: Converging trendlines with no clear bias.
- Suggest potential trend continuation after breakout.
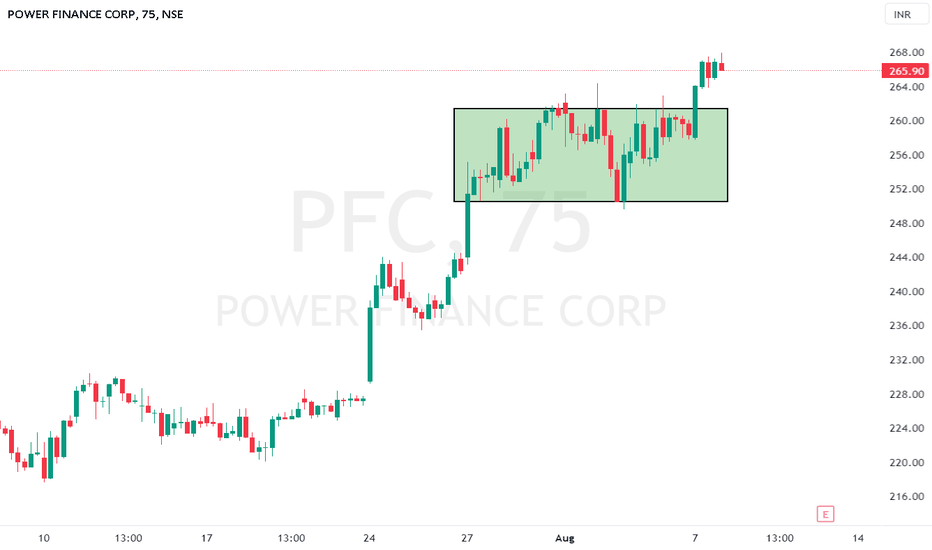
D. Rectangle Pattern
- Consolidation within parallel horizontal support and resistance levels.
- Similar to a sideways channel.
- Suggests a potential trend continuation.
III. Candlestick Patterns
A. Bullish Engulfing
- A larger bullish candle completely engulfs the previous bearish candle.
- Indicates potential bullish reversal.

B. Bearish Engulfing
- A larger bearish candle completely engulfs the previous bullish candle.
- Indicates potential bearish reversal.

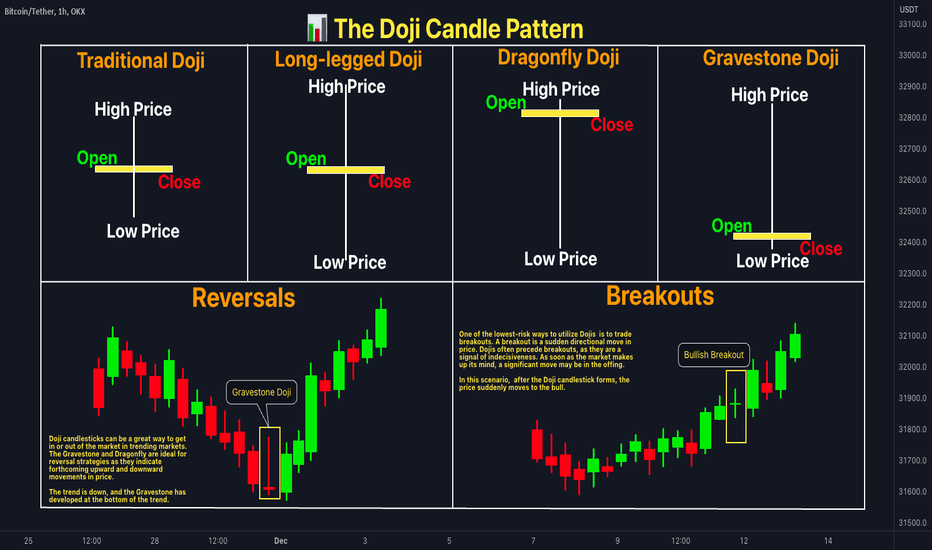
C. Doji
- Open and close prices are nearly the same.
- Suggests indecision in the market and potential reversal.
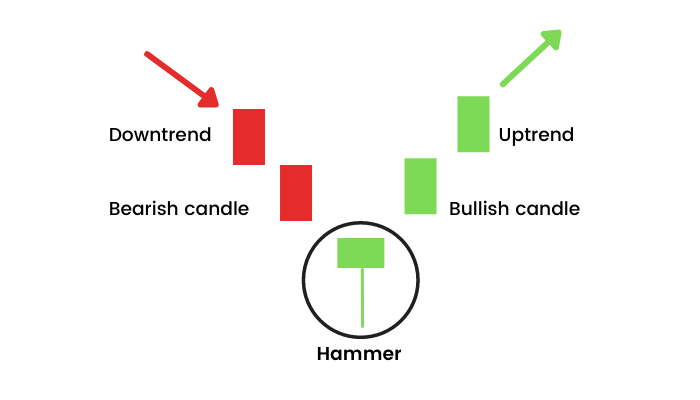
D. Hammer and Hanging Man
- Hammer: Small body, long lower shadow. Bullish reversal signal.
- Hanging Man: Small body, long lower shadow. Bearish reversal signal.
IV. Miscellaneous Patterns
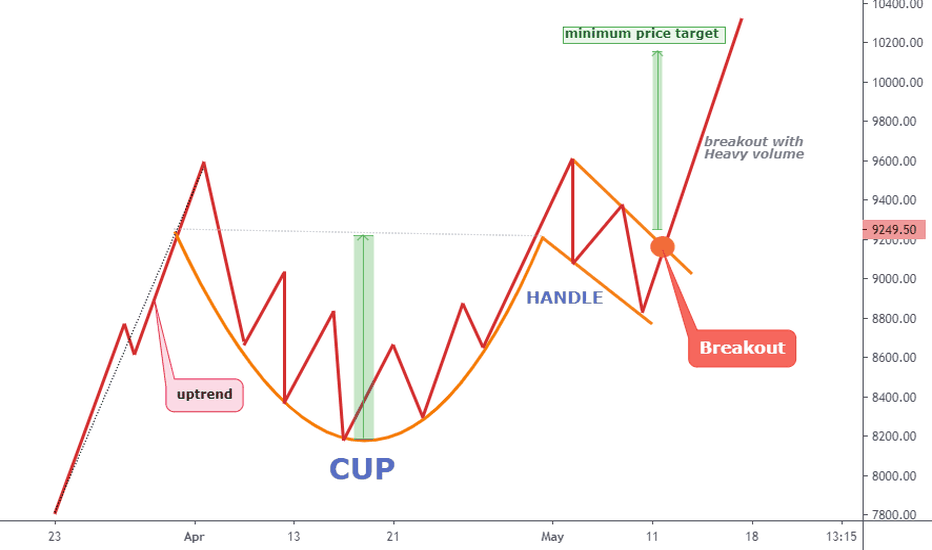
A. Cup and Handle Pattern
- Resembles the shape of a tea cup with a handle.
- Cup forms a rounded bottom, handle forms a consolidation.
- Indicates potential bullish continuation.
B. Wedge Patterns (Rising and Falling)
- Rising wedge: Converging trendlines, bearish reversal signal.
- Falling wedge: Converging trendlines, bullish reversal signal.

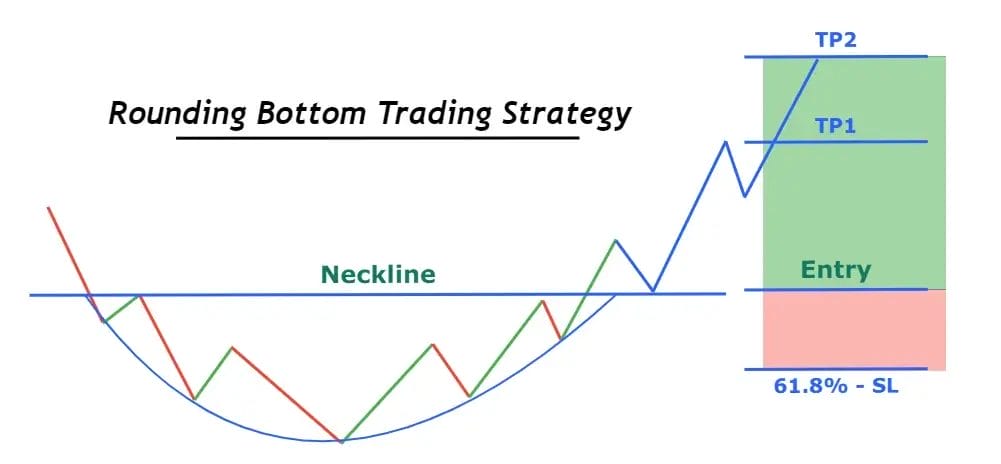
C. Rounding Bottom and Rounding Top
- Rounded bottom: Gradual transition from bearish to bullish.
- Rounded top: Gradual transition from bullish to bearish.
D. Pennant and Symmetrical Triangle
- Pennant: Small symmetrical triangle, continuation pattern.
- Symmetrical triangle: Equal highs and lows, potential continuation.
Remember, these chart patterns should be used in conjunction with other technical and fundamental analysis tools for more accurate decision-making. Patterns alone do not guarantee success, but they provide valuable insights into potential market movements.
Conclusion
This cheat sheet is a summary of some of the most common and useful crypto chart patterns that can help you analyze and predict the price movements of cryptocurrencies. Crypto chart patterns are shapes that form on the price charts of cryptocurrencies, and they can indicate the direction and trend of the market.
There are many types of crypto chart patterns, but we have covered five of them in this cheat sheet: triangle, rectangle, pole, exotic, and wedge patterns. Each of these patterns has different characteristics, meanings, and implications for your trading decisions. You can use this cheat sheet as a quick reference guide to identify and understand these patterns on real crypto charts.
However, you should also remember that these patterns are not 100% reliable, and you should always use other indicators and tools to confirm your analysis. We hope this cheat sheet helps you improve your crypto trading skills and results. Happy trading! ????
New to trading? Try crypto trading bots or copy trading on the best crypto exchanges
For on-demand analysis of any cryptocurrency, join our Telegram channel.
Top 10 Free Indicators for Trading CryptoTOP 6 Play to Earn Crypto GamesTop 18 Crypto & NFT Marketing AgenciesTOP 5 Axie Infinity Staking Platforms: Earn Massive Rewards