How to Trade Harami Candlestick Pattern
In the ever-changing world of finance, The Best traders are the ones who know how to read price charts and figure out what’s going on. One way to do this is to use the art of candle chart analysis. The Harami pattern is the key to unlocking trading secrets and making money.
Table of Contents
Overview of the Harami pattern
The Harami pattern, also known as the “pregnant” pattern or “pregnant candlestick,” is a two-candlestick pattern used for technical analysis to identify potential trend reversal in financial markets. The two candlesticks in the Harami pattern are bullish and bearish, respectively.
The name “Harami” is derived from the Japanese word “harama,” which means “pregnant.” The name is derived from the shape of the two candlesticks, with the smaller one inside the larger one.
What does it look like?
A Harami pattern is a candlestick pattern that consists of two candles. It can be either bullish or bearish, and its appearance depends on the type of harami. Let me describe both types:

1. Bullish Harami:
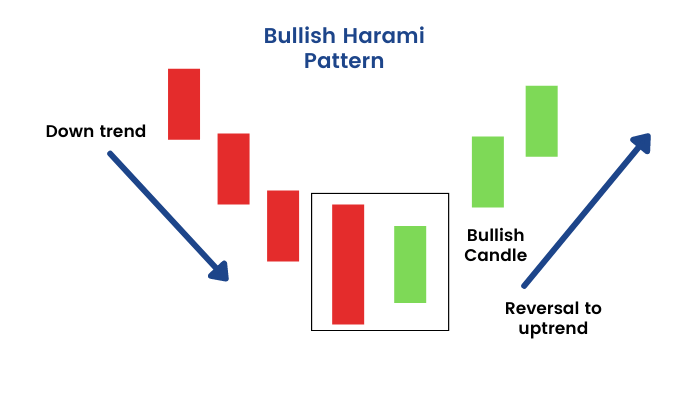
- The first candle is a relatively large bearish (downward) candle.
- The second candle is a smaller bullish (upward) candle.
- The second candle is completely contained within the range (high and low) of the first candle. In other words, the second candle’s open and close are within the open and close of the first candle.
- Visually, a bullish Harami looks like the smaller bullish candle is “inside” the larger bearish candle as if it’s being “hugged” or contained by it.
Join Coincodecap Signals to level up your trading game with automated trading and accurate trading signals with proper explanation.
2. Bearish Harami:
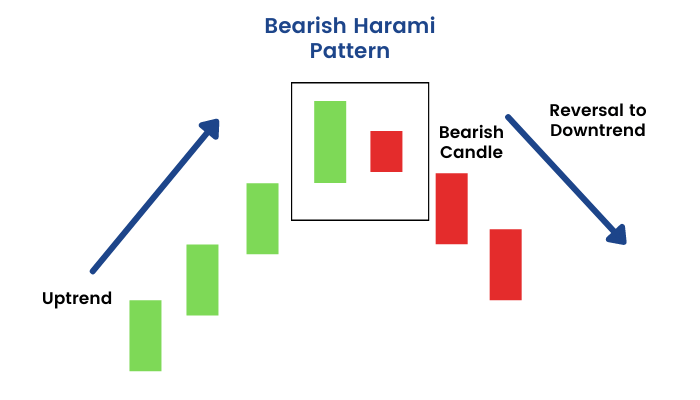
- The first candle is a relatively large bullish (upward) candle.
- The second candle is a smaller bearish (downward) candle.
- Similar to the bullish harami, the second candle is completely contained within the range of the first candle, with its open and close falling within the open and close of the first candle.
- A bearish harami visually appears with the smaller bearish candle “inside” the larger bullish candle.
- Both types of harami patterns are used in technical analysis to identify potential trend reversals, but they indicate opposite directions.
- A bullish harami suggests a potential reversal from a downtrend to an uptrend, while a bearish harami suggests a potential reversal from an uptrend to a downtrend.
Also Read –> How to Trade Morning and Evening Star Candlestick Pattern
Types of Harami Pattern
There are two types of Harami patterns:-
1. Bullish Harami

- The first-day candlestick in a Bullish Harami pattern is commonly seen as having a lengthy bearish (downward) movement, denoting a significant phase of selling pressure.
- The second part of the candlestick is a smaller bullish (upward) candle. Importantly, the second candlestick is contained inside the range (high and low) of the first candlestick on Day 1. In other words, the next candlestick opening and closing are inside the range of the previous day’s candle.
How to trade using Bullish Harami

1. Determine the Pattern
- Before looking for an uptrend Harami, make sure the market is in a downtrend. This means there must be a series of lower highs and lower lows.
2. Confirmation
- Identify the Downtrend Before looking for a bullish harami pattern, ensure that the market is in a downtrend.
- This means that there should be a series of lower highs and lower lows.
- Look for a Large Bearish Candle The first candle in the pattern should be a relatively large bearish candle, indicating strong selling pressure.
- This candle sets the tone for the pattern.
- Identify the Bullish Harami Candle The second candle should be a smaller bullish candle that is completely engulfed within the body of the first bearish candle.
3. Entry
- Once you have confirmation, you can consider taking a long (buy) position.
- The entry point can be slightly higher than the high of the second (bullish) candle.
4. Stop loss and Risk Management
- Always use stop-loss orders to limit possible losses.
- You can place your stop loss below the low of the second candle or at a level that suits your risk tolerance and trading strategy.
- Review your risk management strategy, including position size and percentage risk per trade.
5. EXIT
- Have a clear exit strategy in place.
- If a trade is not going well for you, use a stop-loss order to limit your losses.
- If this works in your favor, consider trailing your stop to lock in profits as the trend continues.
- Determine your profit margin based on your risk-reward ratio and your trading plan.
2.Bearish Harami

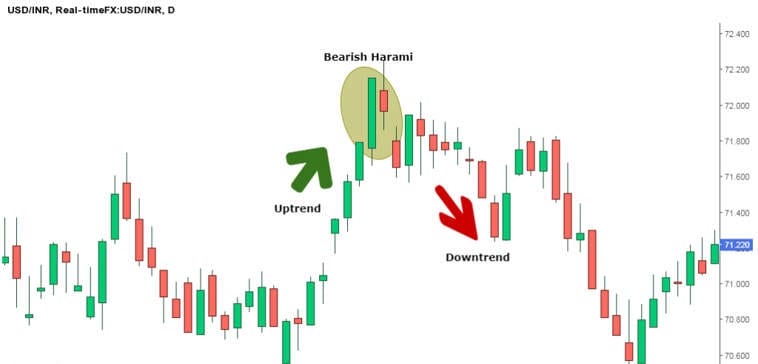
- The Bearish Harami is a candlestick pattern in technical analysis that indicates a possible uptrend reversal. This often occurs after a prolonged uptrend and can indicate that the upward momentum is weakening, possibly signaling a bearish trend reversal.
- The Bearish Harami pattern consists of two candles. The first bullish candle The first candle is a relatively large bullish candle reflecting strong buying sentiment.
How to trade using Bearish Harami

1. Determine the Pattern
- Before looking for a bearish Harami trend, make sure the market is in an uptrend.
- This means there should be a series of higher highs and higher lows.
2. Confirmation
- Look for a large bullish candle The first candle in the pattern should be a relatively large bullish candle, indicating strong buying pressure.
- This candle sets the tone for the pattern.
- Identifying the Bearish Harami Candle The second candle should be a smaller bearish candle, completely contained within the body of the first bullish candle.
- This means that the second candle will open and close within the range of the first candle.
3. Entry
- Once you have confirmation, you can consider entering a short (sell) position. The entry point can be slightly lower than the low of the second (bearish) candle.
4. Stop loss and Risk Management
- Risk Management Consider your risk management strategy, including position size and risk percentage per trade.
- It’s important not to risk more than you can afford to lose.
- Always use a stop-loss order to limit potential losses.
5. EXIT
- Continuously monitor the trade to ensure it is performing as expected.
- Be prepared to adjust your stop loss and take profit if necessary.
- Determine your profit margin based on your risk-reward ratio and your trading plan.
- It can be set on a specific price target or based on technical analysis indicators.
- Have a clear exit strategy in place. If a trade is not going well for you, use a stop-loss order to limit your losses.
Also Read –> How to Trade Cup and Handle Pattern
Also Read –> How to Trade Doji Candlestick Pattern
Conclusion
In conclusion, Harami is a two-sided pattern used in financial analysis to spot potential trend changes. It can be either bullish or bearish, meaning it indicates a change in direction in the opposite direction. If it’s bullish, it means a potential change from a downswing to an upswing, while if it’s bearish, it could mean a change from an upswing to a downswing.
To trade based on this pattern, you’ll need to confirm it with other technical indicators and use the right risk management strategy, like setting a stop-loss order and having a plan for when to exit. Trading is all about having the right tools and strategies in place and understanding a candlestick pattern like Harami can help you make smart decisions in the markets.
(Frequently Asked Question) FAQ
What is the primary purpose of the Harami pattern in trading?
The Harami pattern is primarily used for technical analysis to identify potential trend reversals in financial markets. It helps traders spot possible shifts from bullish to bearish (bearish Harami) or from bearish to bullish (bullish Harami) trends.
Are there different types of Harami patterns?
Yes, there are two main types of Harami patterns: Bullish Harami and Bearish Harami. Each type indicates a potential reversal in opposite directions.
How do I confirm a Harami pattern before trading?
It’s essential to confirm a Harami pattern’s validity by using additional technical indicators or tools, such as trendlines, moving averages, or trading volume. Confirmation helps reduce false signals.
Are there any other candlestick patterns I should learn alongside Harami patterns?
Yes, there are many other candlestick patterns used in technical analysis, such as Doji, Engulfing, and Hammer patterns. Learning a variety of patterns can enhance your trading skills.
