Top 5 Volume Indicators a Trader Must Know
As a day trader, navigating the fast-paced world of financial markets requires a keen understanding of the two pillars of trading price action and volume. These elements are the heartbeat of every strategy and charting system, forming the foundation for informed decision-making.
Although it may be easy to see volume with the naked eye, it can be tough to determine its meaning in real time. This is where trading indicators step in, acting as the guiding compass for traders aiming to make swift, unbiased decisions.
Volume, a pivotal concept in the financial landscape, has earned its place in the toolkit of successful traders. Every financial investor highlights that traders who prioritize volume often outperform those who overlook its significance.
However, understanding volume differences without using indicators can be difficult, just like observing minor patterns in price action. Therefore, in this article, We set out on an exploration to discover the most popular Volume Indicators designed specifically for day trading, illuminating tools that might improve your trading skills in the rapidly changing field of finance.
Table of Contents
What Are Trading Volume Indicators?
They’re a way for traders to figure out how many shares or contracts are being traded for a certain asset over a certain period of time. They show how strong and intense the price movements are, so traders can get a better understanding of what’s going on in the market and make better decisions. There are lots of different types of volume indicators out there, from OBV to CMF to VWAP, and each one has its own unique way of looking at the market. These indicators can help traders spot trends, spot potential ups and downs, and get a better handle on what’s going on.
Why is volume important in trading?
Volume is a crucial factor in trading for several reasons
Market Confirmation
- High trading volume often confirms the validity of a price movement. If prices are rising on high volume, it suggests strong buyer participation, reinforcing the likelihood of a sustained uptrend.
Trend Strength
- The volume provides insight into the strength of a trend. A consistent increase in volume during an uptrend or downtrend indicates the robustness of the trend, while low volume may signal potential weakness.
Price Reversals
- Unusual increases in volume may signal approaching price reversals. Sudden increases in the volume of sales or purchases could signal a shift in the market’s mood, giving traders a chance to predict and respond to trend reversals.
Liquidity and Execution
- Volume reflects market liquidity. Higher volume generally means greater liquidity, making it easier for traders to enter or exit positions with minimal impact on the asset’s price.
Confirmation of Breakouts
- Volume helps verify whether breakout patterns are genuine. A price breakout gains credibility and points to a possible experienced growth when it breaks through a strong support or resistance level with high volume.
Divergence Analysis
- Examining volume alongside price can reveal divergences. For example, if prices are rising, but volume is decreasing, it may indicate weakening momentum and a possible trend reversal.
Informed Decision-Making
- Volume indicators provide traders with additional information to make more informed decisions. By understanding the intensity of market activity, traders can better assess the reliability of price movements and adjust their strategies accordingly.
In summary, volume serves as a critical tool in trading, offering valuable insights into market dynamics, trend strength, and potential reversals. Traders who incorporate volume analysis into their strategies gain a deeper understanding of market conditions, enhancing their ability to make well-informed and timely decisions.
Also Read –> Understanding the Relative Strength Index (RSI)
The Top 5 Volume Indicators
When it comes to trading, incorporating volume indicators into your analysis can provide valuable insights into market dynamics. Here are five top volume indicators that traders frequently use:
How to plot the Volume Indicators in a trading chart? ???? ????
1. Open your trading platform or charting tool.
2. Choose the asset or security you want to analyze.
3. Access the “Indicators” or “Studies” menu.
4. Look for Indicators in the menu.
5. Adjust the Indicator parameters, such as the timeframe.

Also Read: Top 3 best JPY/USD Indicators a Trader must use
1. On-balance volume (OBV)
- OBV is a momentum indicator that adds or subtracts volume based on price movements. Rising OBV confirms an uptrend while falling OBV signals a potential downtrend.
- Pros: Simple to understand, suitable for traders of all levels.
- Cons: May lack precision in complex market conditions.

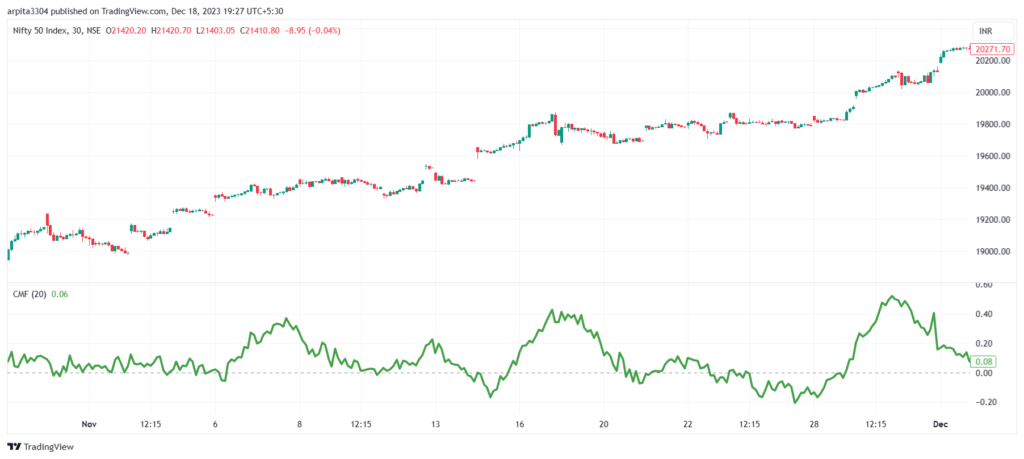
2. Chaikin Money Flow (CMF)
- CMF analyses buying and selling pressure by combining volume and price data. It offers an in-depth insight into market dynamics, which is especially helpful in spotting possible trend reversals.
- Pros: Effective in detecting divergence and trend changes.
- Cons: Requires a good understanding of market conditions.

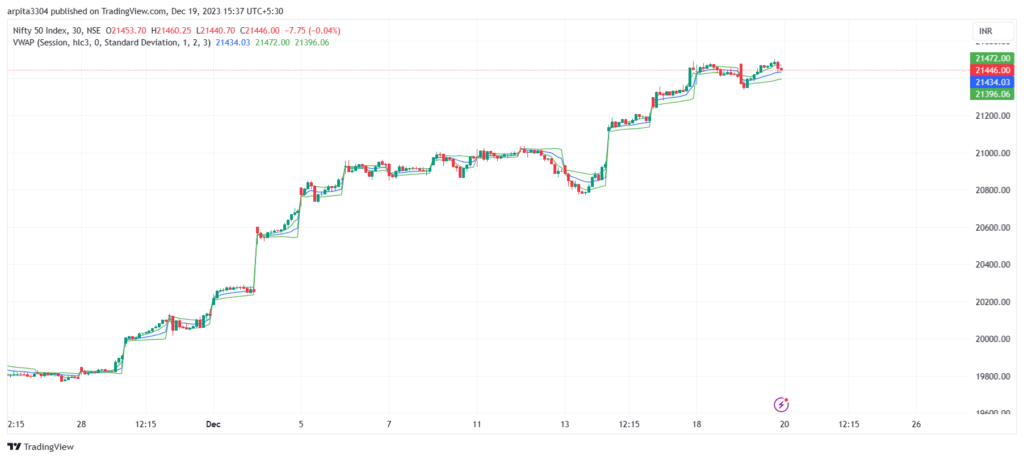
3. Volume Weighted Average Price (VWAP)
- VWAP calculates the average price of an asset based on both volume and price. Traders use it to assess the average entry points of institutional investors.
- Pros: Useful for understanding fair value in intraday trading.
- Cons: Less suitable for short-term traders.

4. Accumulation/Distribution (A/D) Line
- A/D Line evaluates the cumulative flow of money into or out of an asset. The rising A/D Line confirms a healthy trend.
- Pros: Effective in confirming trends and identifying potential reversals.
- Cons: May lag in indicating trend reversals.

5. Money Flow Index (MFI)
- MFI combines price and volume to measure the strength of money flowing in and out of a security.
- Pros: Useful for identifying potential trend reversals.
- Cons: Should be used in conjunction with other indicators for comprehensive analysis.
These volume indicators offer a range of perspectives on market activity, allowing traders to make informed decisions based on the intensity and direction of buying and selling pressure. It’s essential to understand each indicator’s strengths and limitations and consider incorporating them into a broader trading strategy.
Join Coincodecap Signals to level up your trading game with automated trading and accurate trading signals with proper explanation.

Conclusion
In an ending note, volume plays a critical role in trading to navigate the market’s ups and downs and identify trends, and potential reversals.
The top five volume indicators—OBV, CMF, VWAP, A/D Line, and MFI—offer valuable perspectives. However, traders should be aware of each indicator’s pros and cons.
Using these indicators with other tools not only helps in a complete understanding of the market but also enhances decision-making for successful trading.
In the ever-changing world of markets, stay updated and leverage a variety of indicators to make more intelligent trading decisions.
Want to know more about Indicators read ↩️
▶️Understanding Moving Average Convergence Divergence (MACD)
▶️Top 3 best JPY/USD Indicators a Trader must use
▶️Understanding the Bollinger Bands Indicator
▶️Understanding the Relative Strength Index (RSI)
▶️Understanding the OBV(On Balance Volume)
