10 Top Charting Tools for Traders
In today’s fast-moving financial markets, traders rely heavily on advanced charting tools to analyze trends, spot opportunities, and execute trades with precision. Whether you trade crypto, stocks, forex, or derivatives, a powerful charting platform can make the difference between guessing and making informed decisions. Below are the 10 Top charting tools for traders, ranked by usability, chart quality, and analytical features.
What Are Charting Tools?
Charting tools are software platforms that allow traders to visualize market data—such as price movements, trading volume, and technical indicators—through charts and graphs. These tools are essential for analyzing trends, identifying patterns, and making informed trading decisions.
They help traders perform technical analysis, draw support and resistance levels, study candlestick behavior, and execute strategies with precision. Whether you trade stocks, crypto, forex, or commodities, charting tools serve as the foundation of your analytical workflow.
Things to Consider Before Choosing a Charting Tool
- Market Coverage: Ensure the charting platform supports the markets you trade—whether it’s stocks, crypto, forex, or futures—so you don’t have to rely on multiple tools.
- Indicators and Drawing Tools: Choose a tool that provides a wide range of technical indicators and drawing features, giving you the flexibility to analyze price action the way you prefer.
- Ease of Use: Look for a platform with a clean, intuitive interface that makes it easy to navigate and perform analysis without unnecessary complexity.
- Real-Time Data Quality: Make sure the tool offers fast and reliable real-time data, as delayed or inaccurate prices can lead to poor trading decisions.
- Customization and Scripting: If you rely on custom indicators or automated strategies, pick a charting tool that allows scripting or customization to match your trading style.
- Backtesting Features: Traders who test strategies should select a tool that supports strong backtesting capabilities and provides access to historical market data.
- Alerts and Notifications: A good charting platform should allow you to set price, indicator, or condition-based alerts so you can stay updated without constantly monitoring the screen.
- Broker and Exchange Integration: If you prefer trading directly from your charts, choose software that integrates smoothly with your preferred broker or exchange.
- Pricing and Subscription Plans: Evaluate the cost of the platform and determine whether its features justify the subscription price for your needs.
Also, you may read Top 10 Best Trading Podcast
List of Top Charting Tools for Traders
1. TradingView

TradingView is widely regarded as the leading charting platform for traders across all markets, offering an intuitive interface, powerful analysis tools, and real-time data in a highly customizable environment. Its extensive library of indicators, combined with the ability to create custom scripts using Pine Script, makes it suitable for beginners and professionals alike.
With a massive global community sharing ideas, charts, and strategies, TradingView has become the central hub for technical analysis and market insights.
Key Advantages of TradingView:
- Highly customizable charts with hundreds of built-in indicators and drawing tools.
- Pine Script support that allows traders to build custom indicators and automated strategies.
- Cross-device accessibility, available on web, desktop, mobile, and integrated in many exchanges.
- Active social community where traders share ideas, analysis, and real-time market insights.
Also, you may read Best Alternatives to TradingView for Crypto Price Tracking
2. cTrader

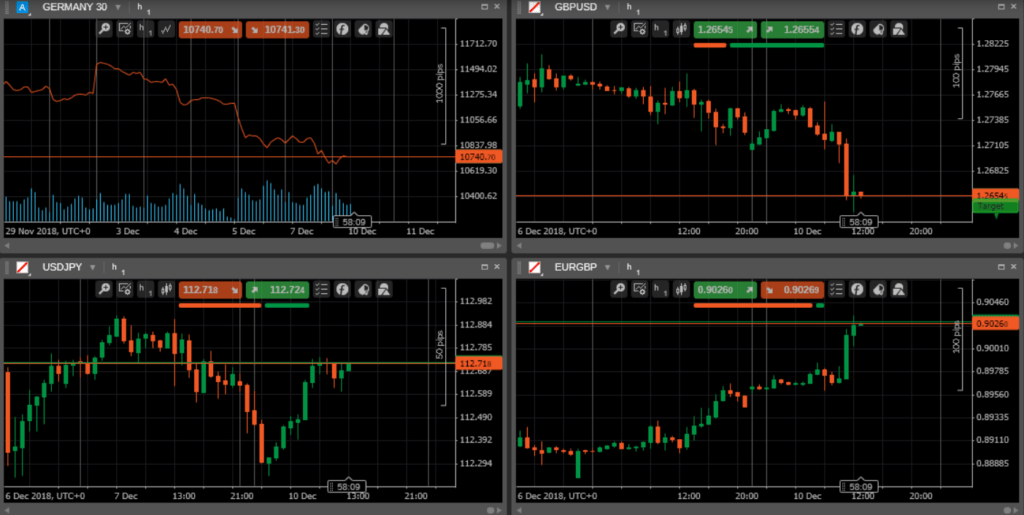
cTrader is a professional-grade trading platform highly popular among forex and CFD traders for its clean interface, fast execution, and advanced charting features. Designed with both beginners and advanced traders in mind, it offers powerful analytical tools, multiple chart types, and seamless access to depth-of-market information.
Its algorithmic trading environment, cAlgo, enables traders to build automated strategies with ease, making cTrader a well-rounded solution for discretionary and systematic trading.
Key Advantages of cTrader:
- Advanced charting tools with multiple timeframes, detailed drawing options, and customizable layouts.
- cAlgo automation support, allowing traders to create, test, and deploy algorithmic strategies.
- Level II depth-of-market (DOM) for precise insights into market liquidity and order flow.
- Fast, reliable execution with a user-friendly interface designed for smooth order management.
Also, you may read Top 5 Crypto App on the Apple App Store
3. GoCharting

GoCharting is a modern, web-based charting platform designed especially for crypto, derivatives, and order-flow traders who demand more advanced visualization tools than traditional charting sites. It provides real-time market data, a wide range of indicators, and powerful features like footprint charts, heatmaps, and volume profile analysis.
With its sleek interface and exchange integrations, GoCharting has become a preferred choice for traders who want professional-grade market insight without installing heavy desktop software.
Key Advantages of GoCharting:
- Advanced order-flow tools such as footprint charts, heatmaps, and volume profile for deeper market analysis.
- Real-time data and multi-exchange integration, allowing traders to monitor multiple markets seamlessly.
- Highly customizable interface, supporting custom layouts, indicators, and detailed visual adjustments.
- Browser-based accessibility, offering professional charting performance without any installations.
Also, you may read Top Statistical Analysis Tools for Data Analysis
4. TrendSpider

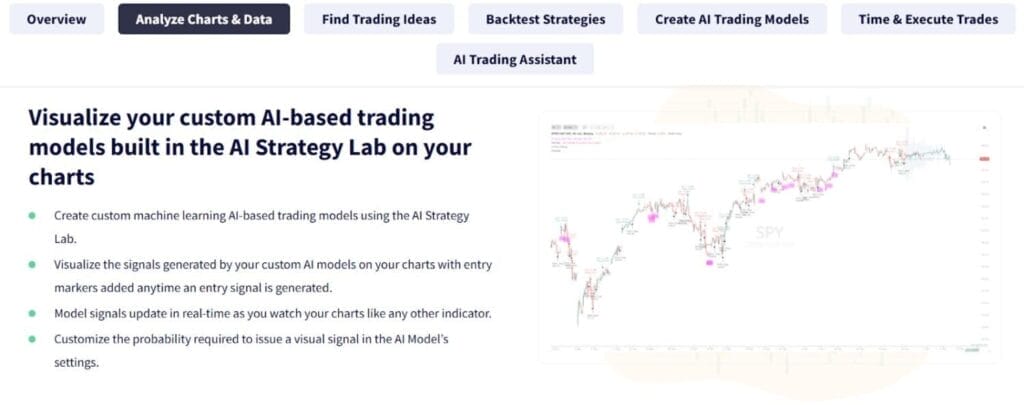
TrendSpider is an advanced, automation-focused charting platform designed to help traders analyze markets faster and more accurately. It uses automated trendline detection, smart alerts, and dynamic technical analysis tools to reduce manual effort and eliminate charting bias. With features like multi-timeframe analysis, automated Fibonacci levels, and strategy backtesting, TrendSpider gives traders a powerful edge by combining AI-driven insights with professional-level charting.
Key Advantages of TrendSpider:
- Automated technical analysis that identifies trendlines, chart patterns, and key levels without manual drawing.
- Multi-timeframe and multi-factor analysis for deep, precise market insights across different time horizons.
- Smart alerts and scanning tools that notify traders when conditions or patterns form in real time.
- Built-in backtesting and strategy testing, allowing traders to validate ideas using historical data.
Also, you may read 8 Best Crypto Scalping Bots
5. eSignal

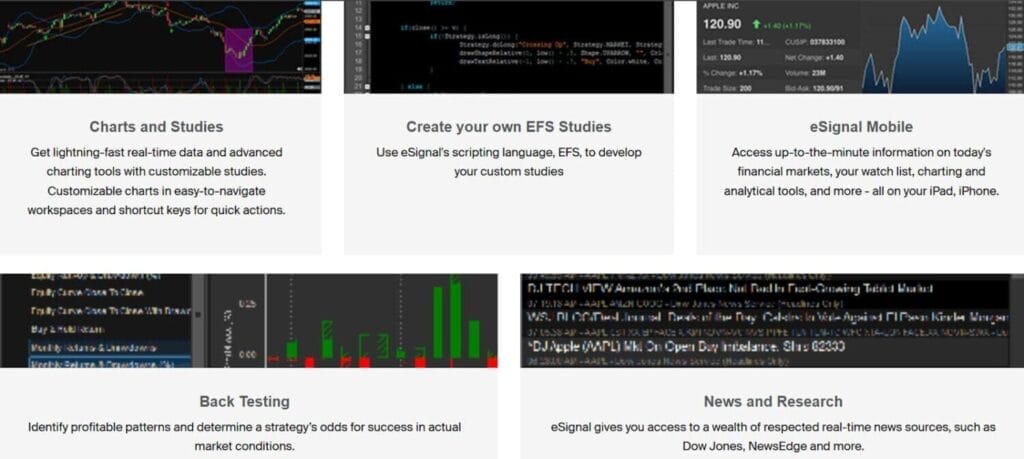
eSignal is a premium charting and market analysis platform known for its professional-grade data feeds, advanced charting tools, and highly customizable studies. Widely used by active traders and institutions, it offers extensive historical data, powerful scanning capabilities, and the ability to build custom indicators using its proprietary scripting language, EFS. With fast, reliable real-time data and a deep suite of tools, eSignal is ideal for traders who demand precision and robust analytics for stocks, futures, forex, and options.
Key Advantages of eSignal:
- Professional-grade real-time data with extensive historical depth for accurate and detailed market analysis.
- Highly customizable charts and indicators, supported by the EFS scripting language for building advanced studies.
- Powerful market scanners that help traders identify patterns, breakouts, and opportunities across multiple assets.
- Institutional-level tools such as advanced drawing features, market profiles, and integration with major brokers.
6. YCharts

YCharts is a powerful financial research and charting platform designed for investors, analysts, and portfolio managers who need deep fundamental data and clean visualizations. While not built for day trading, YCharts excels in long-term market research, company valuation analysis, economic data tracking, and portfolio performance monitoring. Its intuitive interface and data-rich charts make it especially popular among financial advisors and institutions looking to create clear, professional reports and client presentations.
Key Advantages of YCharts:
- Extensive fundamental and economic data, offering detailed insights into company financials, macro trends, and market conditions.
- Professional-grade visualizations and reports, ideal for advisors and analysts who need clean, client-ready charts.
- Advanced screening tools, allowing users to filter stocks, ETFs, and funds based on financial metrics and performance.
- Portfolio analytics and comparison features, helping investors evaluate allocations, track returns, and spot opportunities.
7. StockCharts

StockCharts is a widely trusted charting platform known for its clean interface, reliable data, and strong focus on technical analysis for equities, ETFs, and market breadth indicators. It caters to both beginner and experienced traders by offering easy-to-read charts, a variety of respected indicators, and specialized tools like PerfCharts and SharpCharts. With its emphasis on simplicity, clarity, and educational resources, StockCharts remains a go-to option for traders who want powerful charting without unnecessary complexity.
Key Advantages of StockCharts:
- Clean, easy-to-understand charting layouts that make technical analysis accessible to traders of all experience levels.
- Extensive library of classic indicators, including market breadth tools that are especially valuable for equity traders.
- Specialized tools like PerfCharts, CandleGlance, and SharpCharts for quick comparative and multi-asset analysis.
- Rich educational resources and community content, helping traders learn, explore strategies, and improve skills.
Also, you may read Top 5 Crypto Prediction Markets
8. ProRealTime

ProRealTime is a high-end charting and trading platform known for its exceptional data accuracy, smooth charting experience, and advanced automation features. Popular among European traders and professionals, it offers high-quality historical data, powerful backtesting tools, and a highly customizable interface. Its proprietary ProBuilder language allows users to create sophisticated indicators and automated strategies, making ProRealTime a preferred solution for traders who rely on precision and systematic analysis.
Key Advantages of ProRealTime:
- High-quality historical and real-time data, ensuring accurate charting and reliable technical analysis.
- Advanced backtesting and automation tools, enabling traders to develop and optimize systematic trading strategies.
- Highly customizable charts and layouts, allowing traders to tailor the platform to their preferred workflow.
- ProBuilder scripting language, which supports building complex custom indicators and algorithmic trading systems.
Also, you may read 12 Best tools for STOCK research
9. Sierra Chart

Sierra Chart is a professional-level trading and charting platform renowned for its ultra-fast performance, deep customization, and advanced order-flow tools. Favored by futures and high-frequency traders, it delivers extremely low-latency charting, reliable data processing, and powerful analytical capabilities. With support for custom studies, depth-of-market (DOM) tools, TPO profiles, and automated trading systems, Sierra Chart provides the precision and flexibility needed by serious market technicians and active intraday traders.
Key Advantages of Sierra Chart:
- Ultra-low latency charting and data processing, ideal for futures, scalping, and high-frequency trading strategies.
- Advanced order-flow and market-depth tools, including footprint, TPO, volume profiles, and detailed DOM views.
- Extensive customization, allowing traders to modify chart styles, build custom studies, and tailor layouts for specific workflows.
- Robust automation support, enabling algorithmic strategies through ACSIL (Advanced Custom Study Interface and Language).
Also, you may read Futures Grid Trading Explained
10. CryptoView

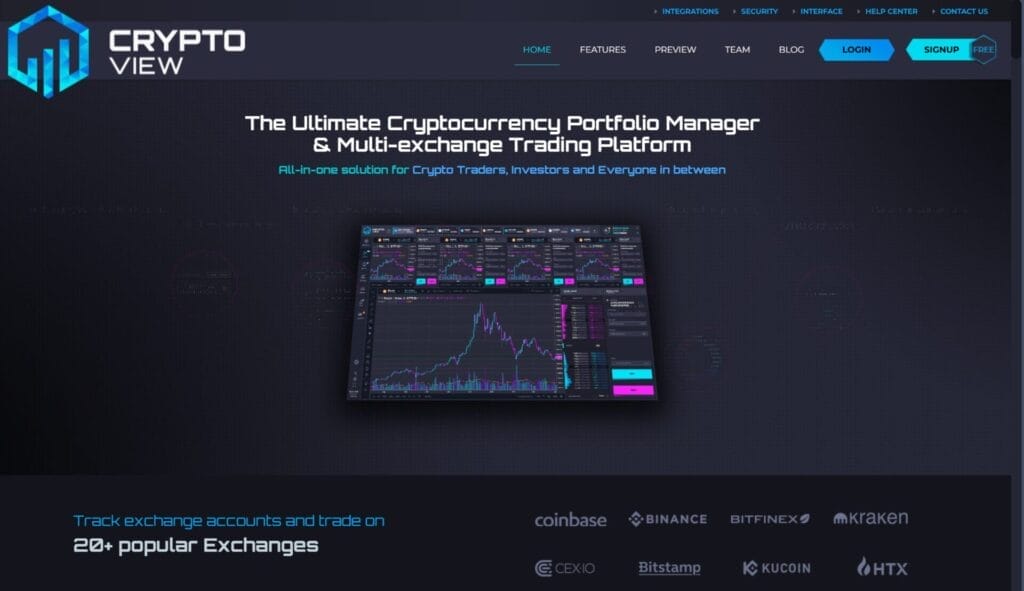
CryptoView is an all-in-one crypto portfolio management and charting platform designed for traders who want to monitor multiple exchanges in a single, unified interface. It offers clean, TradingView-powered charts, multi-exchange API connectivity, portfolio tracking, and a customizable workspace for technical analysis. CryptoView is especially useful for active crypto traders who juggle multiple platforms, as it consolidates balances, open orders, and charts into one streamlined dashboard.
Key Advantages of CryptoView:
- Multi-exchange integration, allowing users to connect and manage trading accounts from various crypto exchanges in one place.
- TradingView-powered charting, providing reliable charts, indicators, and drawing tools familiar to many traders.
- Unified portfolio tracking, enabling users to monitor balances, performance, and allocations across different wallets and exchanges.
- Customizable workspaces, letting traders create multiple layouts with charts, watchlists, and trade panels for improved workflow.
Top Charting Tools for Traders: Fees Comparison
| Platform | Starting/Base Fee | Notes |
|---|---|---|
| TradingView | ~$14.95/month | Lowest tier; higher tiers cost more depending on features. |
| cTrader | Platform itself free | Charting platform is free; costs come via broker/trading fees. |
| GoCharting | ~$17/month | Entry-level pricing; higher tiers add more advanced features. |
| TrendSpider | ~$82/month | Basic plan; additional market data or higher tiers cost more. |
| eSignal | ~$67/month | Delayed data version; real-time/full version is significantly higher. |
| YCharts | ~$275-$300/month | Geared toward professional analysts and advisors rather than casual users. |
| StockCharts | $19.95/month | Basic tier; other plan levels are $29.95-$49.95/month. |
| ProRealTime | ~$6/month | Data-access/minimum cost; full desktop version costs around ~$84/month. |
| Sierra Chart | Modular pricing | Licensing + monthly data fees; cost varies heavily by markets/data. |
| CryptoView | Pricing unspecified | Crypto-centric charting + portfolio tool; need current plan from vendor. |
Conclusion
With so many charting tools available, the best choice comes down to your trading style, budget, and the features you value most. From simple, user-friendly platforms to advanced professional systems, each tool on this list offers something unique. By comparing their strengths, pricing, and capabilities, you can choose the charting solution that fits your workflow and helps you make smarter, more confident trading decisions.
Frequently Asked Questions
Which charting platform is best for professional or advanced traders?
Platforms like Sierra Chart, ProRealTime, and eSignal are popular among advanced and institutional traders because they offer high-precision data, advanced order-flow tools, and deep customization.
What charting platform is best for crypto traders?
GoCharting and CryptoView are great for crypto-focused traders, especially those who want multi-exchange connectivity or advanced order-flow tools.
Do charting tools include real-time data?
Some do, but many platforms charge extra for real-time or premium market data—especially for stocks, futures, and options. Always check the data feed details.
