
How to Trade Triangle Pattern

If you’re a trader, triangle patterns are a key part of your technical analysis. They’re a great way to predict price movements and make smart decisions in the markets. Triangle patterns are made up of converging trendlines that represent periods of consolidation and uncertainty. In this guide, we’ll look at what different types of triangle patterns are, why they’re important, and how you can use them to identify trading opportunities and manage your risk.
Overview of the Triangle Pattern
A triangle pattern is a type of technical analysis that looks like a line running down a price chart. It’s a sign that the market is in a state of consolidation or uncertainty, and it usually means that a breakout could happen soon, either up or down. There are different kinds of triangle patterns, but there are three main ones.

What does it look like?
- Symmetrical Triangle: In a symmetrical triangle, both the top and bottom trend lines are pointing in the same direction, so it looks like the market is balanced. Once the price of the triangle breaks out, you can expect a big price movement.
- Ascending Triangle: An ascending triangle is a pattern where the bottom trendline is pointing up while the top trendline is pointing down. It’s usually a sign that the market is expecting the price to go up.
- Descending Triangle: A descending triangle is a pattern where the top line is horizontal and the bottom line is sloping down. This is usually a sign that the market is expecting the price to go down.

Traders use the triangle pattern as a way to enter and exit their trades, and the direction of the breakouts can give them a sign for their trading plan.
Types of Triangle Pattern
1. Ascending Triangle
An ascending triangle is a technical chart pattern in trading that typically signals a bullish continuation of an existing trend. It is characterized by two key components:
A. Horizontal Resistance Line: The upper trendline of the ascending triangle is a horizontal line that connects a series of similar highs, indicating that sellers are consistently unable to push the price below this level.
B. Ascending Support Line: The lower trendline of the ascending triangle is an upward-sloping line that connects a series of higher lows, suggesting that buyers are progressively willing to pay higher prices.
- An Ascending triangle shows that buyers are getting more aggressive and gradually pushing the price up, while sellers are giving up some of their power, as the flat resistance line shows.
- This type of pattern usually means that a bullish breakout is more likely to happen than a bearish one.
- If you’re a trader, you want to see a clear and strong breakout above a horizontal resistance line so you can jump in and buy. You want the price to keep going up. But you also want to make sure you’re using the right technical analysis tools and confirming the breakout so you can manage risk properly.

Also Read –> How to Trade Morning and Evening Star Candlestick Pattern
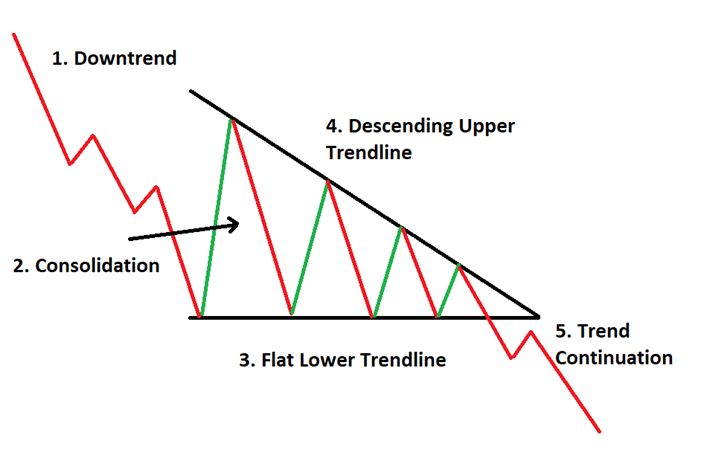
2. Descending Triangle
A descending triangle is a bearish chart pattern in technical analysis. It’s characterized by two main components:
A. Horizontal Lower Trendline: The lower trendline in a descending triangle is horizontal, indicating a level of support where the price tends to find buying interest.
B. Descending Upper Trendline: The upper trendline in a descending triangle slopes downward, showing a series of lower highs.
- The descending triangle pattern typically suggests a bearish sentiment in the market. Here’s how it looks:
- The price repeatedly tries to break through the horizontal lower trendline but fails, indicating that buyers are struggling to push the price higher.
- On the other hand, the descending upper trendline shows that sellers are consistently pushing the price lower, creating a pattern of lower highs.
- This creates a triangular shape with a horizontal lower line and a descending upper line, hence the name “descending triangle.”
- Traders often think a descending triangle is a sign that the price is going to keep going down. If the price drops below the support line, they might think it’s time to short-sell and buy back the asset. But it’s important to use extra analysis and risk management when trading on a descending triangle, just like any other technical pattern.
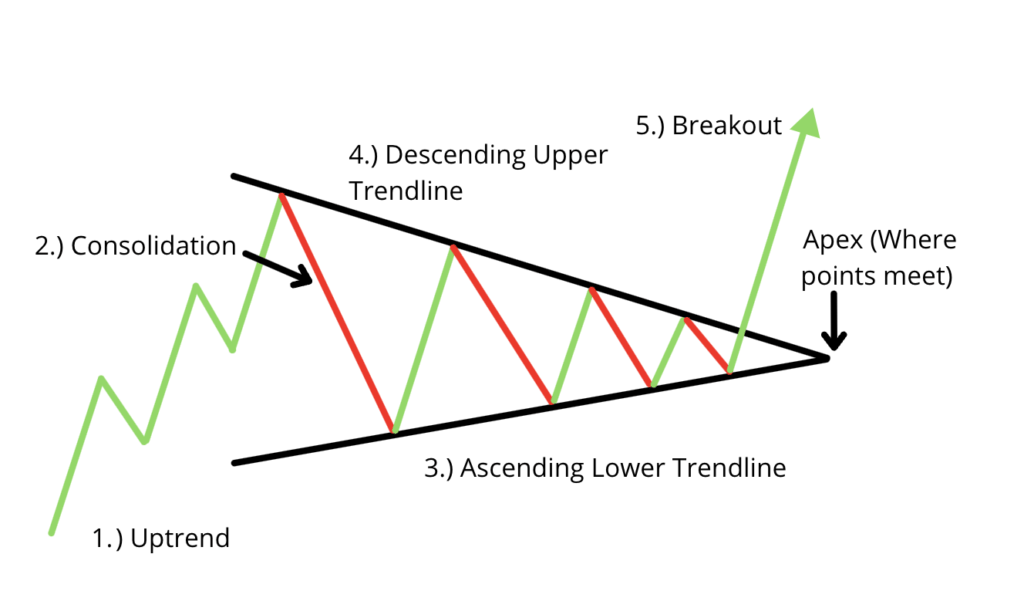
3. Symmetrical Triangle
A symmetrical triangle is a technical chart pattern in trading that forms when the price of an asset experiences a period of consolidation, resulting in converging trendlines. In a symmetrical triangle pattern:
A. Upper Trendline: This trendline connects the lower highs that the price has been making during the consolidation phase. It slopes downward.
B. Lower Trendline: This trendline connects the higher lows that the price has been making during the consolidation phase. It slopes upward.
- The two trendlines meet at a point, creating a symmetrical triangle shape on the price chart.
- Symmetrical triangles are neutral patterns, meaning they do not inherently suggest a bullish or bearish bias. Instead, they indicate a period of indecision in the market, where buyers and sellers are in equilibrium.
- Traders often use symmetrical triangles to anticipate a potential breakout. They look for a clear price move above the upper trendline (bullish breakout) or below the lower trendline (bearish breakout) as a signal to enter a trade in the direction of the breakout.
Join Coincodecap Signals to level up your trading game with automated trading and accurate trading signals with proper explanation.
Trading using a Triangle pattern
If you’re looking to trade, triangle patterns are a great way to go. They’re patterns that show up on price charts, and you can use them as a way to enter and exit trades. If you’re not sure how to use triangle patterns, here’s a quick guide.
1. Identify the Triangle Pattern:
- First, recognize the type of triangle pattern (symmetrical, ascending, or descending) on your price chart.
2. Wait for Confirmation:
- Wait for a clear breakout of the triangle pattern. A breakout occurs when the price moves decisively above or below one of the trendlines.
3. Entry Point:
- Once the breakout is confirmed, consider entering a trade in the direction of the breakout. Buy if it’s an upside breakout (bullish) or sell if it’s a downside breakout (bearish).
4. Set Stop Loss:
- Always set a stop-loss order to limit potential losses. Place it just outside the triangle in the opposite direction of your trade.
5. Determine Target:
- Estimate a target price based on the height of the triangle pattern. For example, if the triangle is 100 points high, your target might be 100 points in the direction of the breakout.
6. Risk-Reward Ratio:
- Ensure that your potential reward is greater than your risk. A common rule is to aim for a risk-reward ratio of at least 1:2, meaning your potential profit should be at least twice the size of your potential loss.
7. Monitor Trade:
- Keep a close eye on your trade as it progresses. If the price moves significantly against your trade, consider adjusting your stop loss or exit strategy.
8. Take Profits:
- When the price reaches your target or shows signs of a reversal, consider taking profits by closing your trade.
9. Review and Learn:
- After the trade is complete, review your performance. Analyze what went well and what could be improved for future trades.
Remember that triangle patterns are not foolproof, and false breakouts can occur. It’s essential to use additional technical analysis tools and indicators to confirm your trading decisions and manage risk effectively.
Also Read –> How to Trade Morning and Evening Star Candlestick Pattern
Example of Triangle pattern in Trading chart
Here is a chart of Binance Coin that shows a Symmeritical Triangle Pattern.

Conclusion
Triangle patterns are super important because they help you predict price movement and make it easier to make the right trades. Triangle patterns are converging trend lines that represent a period of consolidation or uncertainty. There are three main types of triangle patterns: symmetrical triangle, ascending triangle, and descending triangle.
When using triangle patterns, you need to figure out what pattern you’re looking for, check it out, figure out how it’s going to break, set your entry and exit point, manage your risk, set a goal, and keep an eye on it. You should keep an eye on the pattern, adjust your stop-losses and take-profits, think about taking some profit, and be careful not to get caught in a false breakout. Finally, when the price hits a target or the trade isn’t moving as expected, you should exit the trade. It’s also a good idea to pair your technical analysis with some other type of analysis, like fundamental analysis.
(Frequently Asked Question) FAQ
What Are the Three Main Types of Triangle Patterns?
There are three main kinds of triangle patterns: Symmetrical, Ascending, and Descending.
Are Triangle Patterns Suitable for Day Trading and Longer-Term Investing?
You can use triangle patterns in different timeframes, like day trading or investing in the long run. It all depends on what you’re trying to achieve and how you’re trading.
Can Triangle Patterns Be Used for Both Forex and Stock Trading?
Triangles are useful because they can be used in a lot of different financial markets, like forex and stocks. A lot of traders use them to find trades in different types of assets.
How Long Does It Typically Take for a Triangle Pattern to Form?
It can take anywhere from a few days to a few months for a triangle to form. It all depends on the market and the time frame you’re using to analyze it.