
Very Best Paid Trading Indicators

Indicators empower traders with Technical Analysis. Moreover, indicators allow you to explore functionalities, trends, and momentum analysis for profitable strategies.
This article will explore the significance of best-paid trading indicators, enabling well-informed decisions in fast-paced markets.
Summary
- Top-paid trading indicators provide valuable insights for traders using technical analysis.
- Liq Hunter identifies liquidation zones for profitable trading opportunities.
- Dynamic Strength Index(DSI) measures the Relative strength index with dynamic bands for momentum signals.
- Nutshell offers a comprehensive overview of the market with various components.
- Ultimate VWAPS supports multiple VWAP-related tools and functions for trading.
- A volatility Heat Map predicts price movements based on volatility levels.
- MOSES Indicator combines moving averages with price action for accurate trade decisions.
- Mega Support/Resistance provides various SMA and EMA indicators and Fibonacci options.
- Ultimate ADXDMI optimizes space with ADX and DMI components for trend analysis.
- Paid indicators offer traders a competitive edge for well-informed decision-making in stock trading.
Top Paid trading indicators
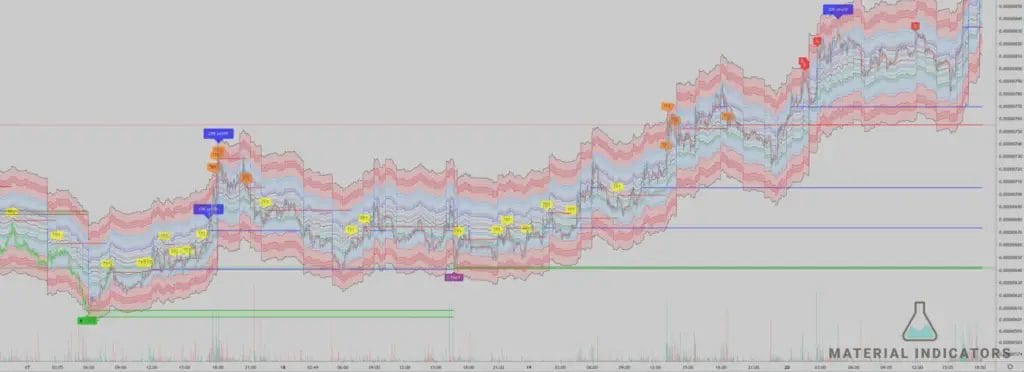
Liq Hunter
- The Liq Hunter indicator displays liquidation zones based on high-volume candles (PVSRA-defined) used by market makers to move markets and trap traders.
- These zones become hunting grounds for market makers and can be used by traders to determine target profit zones.
- The visualization shows the density of liquidations for shorts and longs above and below the price, helping to gauge market maker intentions.
- It is useful in consolidation trading patterns like triangles where traders get trapped on both sides of the zone.
- The direction with the highest volume of trapped traders often leads to the ultimate breakout.
- Further, it can render simple lines or translucent boxes for the zones. It’s configurable with 1 or 2 leverage settings for targeting.
- Auto-updates zones based on visible candle range and can be viewed by zooming and panning the chart.
- In addition, it can use an anchored point in time to produce zones. It works with any timeframe, though it defaults to the chart’s timeframe.
- Optionally renders liquidation zone “hits” by tying candles that fill through the zone back to the original trapping candle.
Dynamic Strength Index (DSI)

- DSI (Dynamic Strength Indicator) is designed to navigate market swings and momentum shifts.
- It measures the Relative Strength Index (RSI) with dynamic bands for context and actionable signals.
- Further, it utilizes a cyclical formula by John Ehlers for automatic Dynamic Strength channel calculation.
- This indicator provides signals for re-entries in dynamic oversold and overbought channels.
- It detects momentum crossings with an optional display of the signal line.
- It is also capable of detecting and displaying normal and hidden divergence.
Nutshell
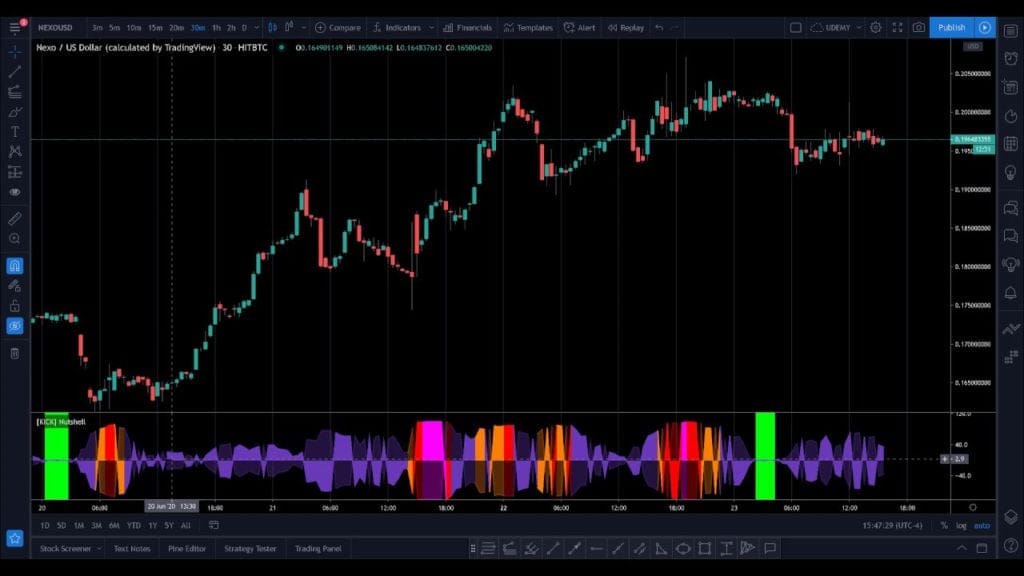
- The nutshell indicator provides a quick and accurate overview of the market.
- Components include volatility, momentum, trend strength, volume flow, price divergence, and impulsive move detection.
- Facilitates improved entry and exit points for various trading styles and strategies.
- This indicator is a Price action volatility and Low volatility warning indicator (ATR-PR based).
- Further, it is also a Gravity Tunnel Squeeze indicator (Z-Score and ATR of CoG), Swing Momentum indicator (Stochastics in WaveTrend style), and Momentum velocity indicator (Custom WaveTrend).
- It offers Volatility Adjusted Volume Waves (ATR-Weighted Volume Cycles) and Strength of Trend (Leaf-West ADX).
- The Topping or Bottoming moves (10+ oscillator divergence tests) and alerts Pump and Dump warnings (proprietary formula).
- Custom alert conditions related to the indicator components are also available for creating alerts.
Ultimate VWAPS
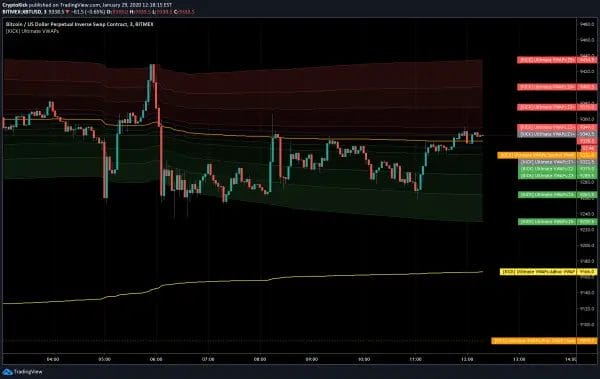
- The Ultimate VWAPS indicator offers multiple VWAP-related tools/functions.
- It enables typical session-based VWAP, resetting every session.
- This indicator allows week-to-date, month-to-date, or year-to-date VWAP activation.
- Further, it also supports anchored VWAPs with automatic anchoring to recent highs or lows or specific dates/times.
- Week/month/year-to-date VWAPs can also be treated as Ad-Hoc with arbitrary anchors.
- It can add support/resistance lines for the last session’s VWAP close.
- Z-Score bands can be added and linked to any VWAP type (Session, AutoHigh, AutoLow, AdHoc/Week/Month/Year).
- Z-Score bands use proper unbiased standard deviation calculation, not the built-in PineScript biased stdev function.
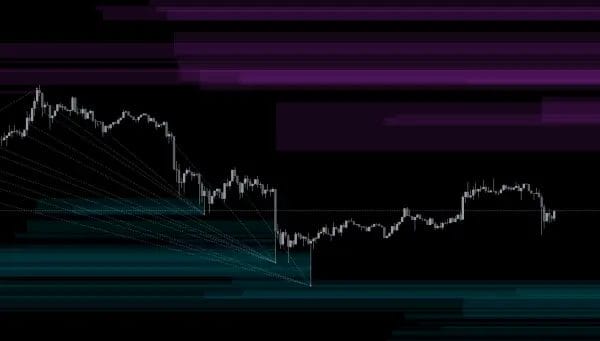
Volatility Heat Map

- The Volatility Heat Map indicator measures price volatility across multiple timeframes and identifies critically low volatility areas.
- It predicts the likelihood of an imminent move or the conclusion of a move.
- Two methods are used to measure volatility: Average True Range Percentile Rank (ATR-PR) or Historical Volatility Percentile (HVP)
- It also generates an alert when the current timeframe volatility level emerges from a critically low volatility zone, signaling the start of a significant move.
- It supports two rendering modes: Smooth and Distinct.
- It can show current timeframe volatility in a bar chart above the heatmap.
MOSES Indicator
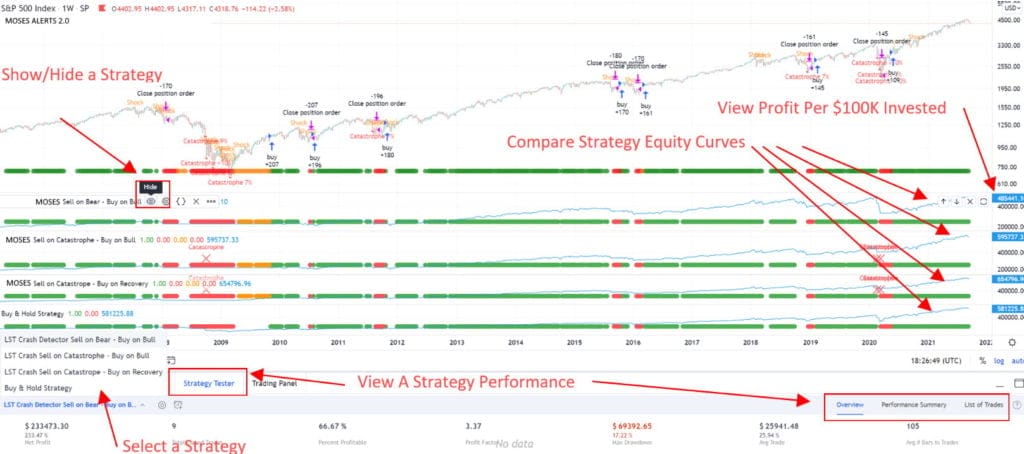
- The MOSES Indicator is accurate and combines multiple moving averages with price action percentage moves to determine when to enter or exit trades.
- MOSES is formed to work on a weekly timeframe and has shown high accuracy on broad market indexes like the Nasdaq 100 and the S&P 500.
- This indicator is fast and reliable, giving traders more confidence in their decisions.
- However, it’s important to note that MOSES is specifically designed for long trades on a weekly timeframe.
- It has a good track record, with a 66.67% win ratio and a 712% return since 1996. Unlike other free indicators, MOSES is available for purchase at $199.
Mega Support/Resistance

- Mega Support/Resistance allows you to use up to 3 SMA/EMA indicators on different timeframes.
- Fibonacci EMA’s are available, including 21, 55, 89, and 200, and you can also choose from 144 and 233 in Vegas Wave.
- The Smoothed Median Moving Average comes with an optional “shadow” feature.
- You can calculate Pivot Points for any timeframe.
- Vegas Wave offers options for 144, 169, and 233.
- VWAP (Volume-Weighted Average Price) is available for both the current and previous sessions close, acting as support and resistance levels.
- Add Z-Score Bands to the Session VWAP or Smoothed Median Moving Average.
- RSI-Based Supply/Demand Zones provide additional analysis capabilities.
Ultimate ADXDMI

- The Ultimate ADXDMI indicator is optimized for compact spaces with ADX and DMI components.
- ADX bar chart shows trend strength with customizable thresholds and peak marking.
- DMI line graphs and color codes on the ADX bar chart indicate the trending direction.
- DI+ and DI- lines can be offset to avoid overlapping the ADX chart.
- The dot map below the ADX chart monitors up to 3 additional timeframes, providing a generalized trend idea for larger timeframes.
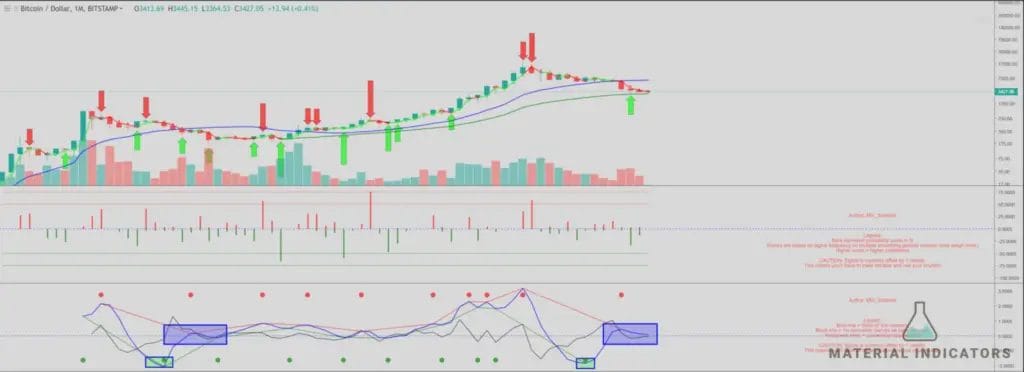
MTF Mean Reversion Indicator
- High frequency mean reversion indicator that alerts you when an asset is entering a potential buy zone with a high probability to bounce.
- Requires a TradingView account.
- Ideal for scalping in low time frames.
- Over 95% of the 200,000+ MTF signals reached at least 1.25% profit within 5 days, with an average of around 3 days.
Trend Precognition Indicators
- Trend Precognition indicator includes a set of on and off chart predictive algorithmic trading indicators which may be optimized relative to any time frames you choose.
- Trend Precognition becomes the trend analysis tool you need to fit how you trade.
- Choose from one of 3 algorithms to work within your trading preferences and then use configuration options for each algorithm to optimize for the specific time frames and strategies you use.
- Trend Precognition can help you validate the current micro trend and signal potential reversals.
Conclusion
Indicators are invaluable tools in stock trading, offering potential entry and exit points and insights into market trends. From the Liq Hunter’s detection of liquidation zones to the Dynamic Strength Indicator’s momentum analysis, traders gain a competitive edge.
Embrace these indicators to make informed decisions and confidently navigate the stock market’s complexities.
Frequently Asked Questions
What are trading indicators?
Trading indicators, or market indicators, are a set of technical tools traders utilize to forecast the potential movement of financial indexes. These indicators are valuable for identifying price changes, recognizing trends in stock markets, and predicting price patterns for various traded assets. Traders rely on these indicators through technical analysis to make informed predictions about market direction and potential price movements.
How to select indicators for trading?
There are three factors to consider, time available for trading, trading experience, and personal abilities. In addition, you must understand the market and choose indicators accordingly to improve trading efficiency. No indicator is perfect, but using appropriate ones can enhance trading performance.
How reliable are technical indicators in trading?
Although technical analysis cannot guarantee a 100% success rate or miraculous profits, it is a comprehensive method for predicting equity market share values. It can be viewed as a form of trade prediction.
New to trading? Try crypto trading bots or copy trading on the best crypto exchanges
For on-demand analysis of any cryptocurrency, join our Telegram channel.
Top 10 Free Indicators for Trading CryptoTOP 6 Play to Earn Crypto GamesTop 18 Crypto & NFT Marketing AgenciesTOP 5 Axie Infinity Staking Platforms: Earn Massive Rewards