How To Trade Triple Top and Bottom Pattern
We’re about to dive into the world of triple top and bottom patterns, where trend analysis meets market mastery! In a world of ever-changing financial markets, this pattern is like a sign of opportunity. Think of it as a triangle of peaks and valleys on the price chart of an asset, each revealing important information about its future direction. So, what are you waiting for? Get ready to dive into a world of profit potential and technical precision!
Table of Contents
Overview of Triple Top and Bottom Pattern
A “Triple Top” and “Triple Bottom” are patterns commonly observed in technical analysis, which is a method used in financial markets to analyze and forecast price movements. These patterns( Triple Top and Bottom) are often associated with trend reversals.
Triple Top
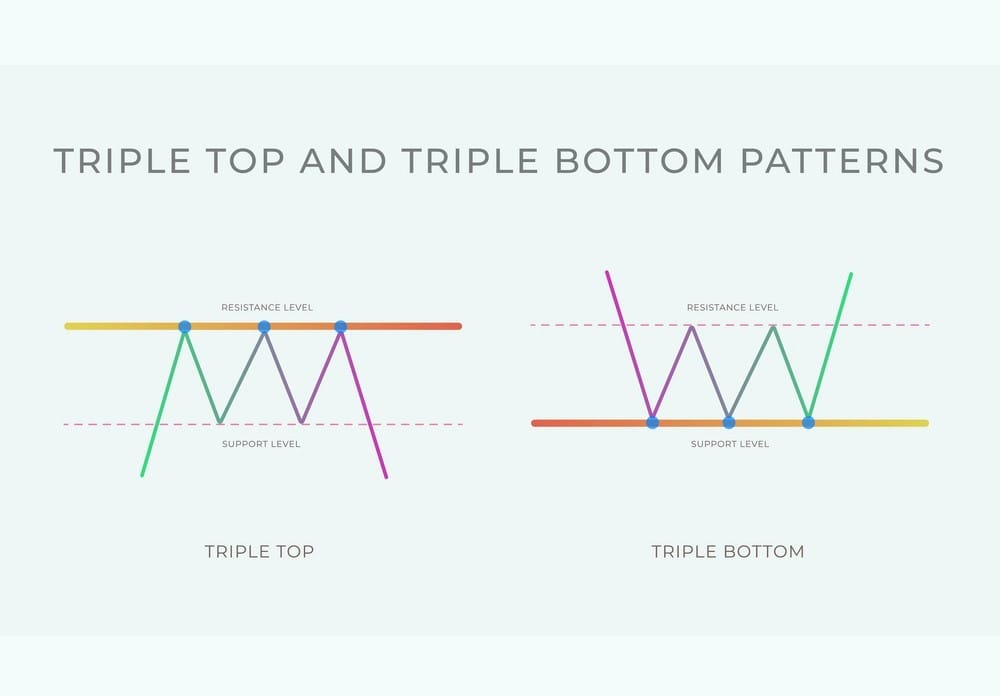
A Triple Top is one of the most common bearish reversal patterns you’ll see in financial markets, especially when it comes to trading and charting. It’s a pattern that appears after a long upswing and is made up of three peaks or “tops” at about the same price. Each peak represents a time when the price of the asset didn’t move higher and then dropped.
Here’s a breakdown of the key features of a Triple Top:
1. Uptrend
This pattern usually appears after a strong and constant rise in price, which means the asset’s value has been under buying pressure for a while.
2. Three Peaks
There are three peaks, or peaks, that are pretty much the same. The first one is the peak, then there’s a dip, then the second peak is at the same price level, then there’s another dip, and then the third peak is at or close to the same price level.
Also Read –>How to Trade Piercing Candlestick Pattern
3. Volume
If you want to know if a Triple Top is legit, you need to do a volume analysis. As the pattern progresses, you’ll usually see more trading volume, which means there’s more interest and more potential for selling.
4. Breakdown
When the price falls below a certain support level, it’s called a “Triple Top”. It’s made up of the lows between three peaks. If the price breaks below this level, it’s a sign that the uptrend could be ending and a bear trend could be starting.
The Triple-top pattern is one of the most common signals used by traders and investors to initiate short positions (sell). It’s a sign that the price of an asset could be about to start a bearish trend. But like any technical pattern, it’s important to pair it with other indicators and your risk management strategy to make the best trading decisions.

Triple Bottom
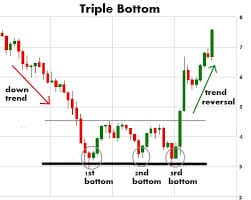
A Triple Bottom is a bullish reversal pattern commonly observed in technical analysis of financial markets, particularly in stock trading and chart analysis. This pattern occurs after a prolonged downtrend and is characterized by three consecutive troughs, or “bottoms,” at roughly the same price level. Each of these troughs represents a point where the asset’s price has failed to move lower and has bounced back.
Here’s a breakdown of the key features of a Triple Bottom:
1. Downtrend
This pattern usually appears after a long and steady decline, which means the price of the asset has been going down for a while.
2. Three Troughs
There are three troughs, or low points, that are pretty much the same. The first one is the low point, then there’s a short-term rally. The second one is at the same price level, then there’s another rally, and the third one is at or close to the same level.
Also Read –> How to Trade Morning and Evening Star Candlestick Pattern
3. Volume
If you want to know if a Triple Bottom is right, volume analysis is key. As the pattern progresses, you’ll usually see more trading volume, which means there’s more interest and more buying pressure.
4. Breakout
A Triple bottom is when the price goes above a certain resistance level that’s made up of the highs between three troughs. If the price breaks above this resistance level, it’s a sign that the trend may be turning around and a bullish trend could be starting.
The Triple Bottom pattern is a popular signal for traders and investors to jump into long positions (buy). It’s a sign that the price of an asset could be about to start going up. But like any technical pattern, it’s important to pair it with other indicators and your risk management strategy to make sure you’re making the right trades.

What does it look like??

How to Trade using Triple Top and Bottom
Trading the Triple Top and Triple Bottom patterns involves identifying these chart patterns on price charts and making trading decisions based on their potential outcomes. Here’s a general guideline on how to trade these patterns:
Trading the Triple Top
1. Identify the Pattern
First, you need to identify a Triple Top pattern on a price chart. Look for three consecutive peaks at approximately the same price level, following a prolonged uptrend.
2. Confirmation
Wait for confirmation of the pattern. This confirmation typically occurs when the price breaks below the support level that connects the lows between the three peaks. This breakdown is a strong signal that the uptrend is potentially reversing.
3. Entry
After confirmation, consider entering a short (sell) position. Some traders may wait for a retest of the broken support level to ensure it now acts as resistance before entering the trade.
4. Stop-Loss and Take-Profit
Always set stop-loss orders to manage risk. Place your stop-loss above the recent swing high or the highest peak in the Triple Top pattern. Determine a target price level where you plan to take profits. This could be based on technical analysis, such as measuring the pattern’s height and subtracting it from the breakdown point.
5. Risk Management
Ensure you have a well-defined risk management strategy, and don’t risk more than you can afford to lose.

Trading the Triple Bottom:
1. Identify the Pattern
Begin by identifying a Triple Bottom pattern on a price chart. Look for three consecutive troughs at approximately the same price level, following a prolonged downtrend.
2. Confirmation
Wait for confirmation of the pattern. This typically occurs when the price breaks above the resistance level formed by connecting the highs between the three troughs. This breakout is a strong signal that the downtrend may be reversing.
3. Entry
After confirmation, consider entering a long (buy) position. Some traders may wait for a retest of the broken resistance level to ensure it now acts as support before entering the trade.
4. Stop-Loss and Take-profit
Similar to trading the Triple Top, set stop-loss orders to manage risk. Place your stop-loss below the recent swing low or the lowest point in the Triple Bottom pattern. Determine a target price level for taking profits, often based on technical analysis or pattern height measurements.
5. Risk Management
Always practice effective risk management and avoid overleveraging your positions.
Remember that no trading strategy is foolproof, and these patterns may not always result in the expected trend reversals. It’s essential to combine pattern analysis with other technical indicators, fundamental analysis, and a clear understanding of market conditions to make informed trading decisions. Additionally, using proper risk management techniques is crucial to protect your capital.

Join Coincodecap Signals to level up your trading game with automated trading and accurate trading signals with proper explanation.
Conclusion
So, there you have it! The world of Triple Top and Bottom patterns can be a great tool for traders and investors to navigate the ever-changing financial markets. When you correctly identify and confirm these patterns, you can get an idea of potential trend changes and potential trading opportunities.
To trade the Triple Top, you’ll need to go short after confirming it and to trade the Triple Bottom, you’ll have to go long. But don’t get us wrong, there’s no one-size-fits-all trading strategy, and you need to be careful about how much risk you’re taking. These patterns need to be used in combination with other technical factors and analysis techniques to make smart decisions. With the right combination of technical accuracy and risk management, you can take advantage of the profit potential of these patterns while avoiding potential losses.
FAQ( Frequently Asked Question)
What are Triple Top and Triple Bottom patterns?
Triple Top and Bottom patterns are common chart patterns in technical analysis. A Triple Top is a bearish reversal pattern with three price peaks, while a Triple Bottom is a bullish reversal pattern with three price troughs. They indicate potential trend reversals.
When do these patterns typically occur?
Triple-top patterns usually appear after a prolonged uptrend, while Triple Bottom patterns develop following an extended downtrend.
How can I confirm these patterns?
Confirmation for Triple Top is when the price breaks below a support level, and for Triple Bottom, it’s when the price breaks above a resistance level formed by connecting highs or lows between the pattern points.
How do I trade these patterns?
For Triple Top, consider short (sell) positions after confirmation, and for Triple Bottom, consider long (buy) positions. Set stop-loss orders define take-profit levels, and always practice proper risk management.
Are these patterns foolproof?
No trading strategy is foolproof. These patterns are signals, not guarantees. Combine them with other indicators and analysis, and be cautious of market conditions.
Can I use these patterns in any financial market?
Yes, Triple Top and Bottom patterns can be applied to various financial markets like stocks, forex, commodities, and cryptocurrencies.
What role does volume play in confirming these patterns?
Increasing trading volume as the pattern develops can help confirm its validity. Higher volume indicates more interest and potential buying or selling pressure.
What’s the importance of risk management in trading these patterns?
Proper risk management is crucial to protect your capital. Always use stop-loss orders, avoid overleveraging, and never risk more than you can afford to lose when trading these patterns.
